BAND Cryptoplayground UPDATECryptoplayground Framework and Built In Strategy Analysis
📝 Notes 📝
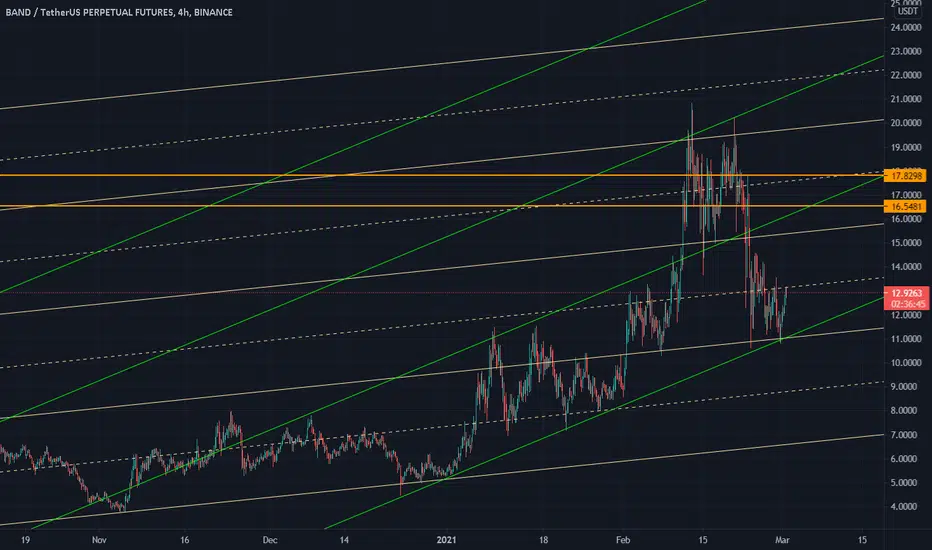
Levels mapped out, resembling what most traders know as support and resistance .
Trading #CPF Entry levels and targets, will reduce risk of a losing trade.
Trade safe: less leverage if you're being stopped out.
"Whales" are playing with over leveraged traders. Be aware that the top traders DO NOT care about the price at which they buy. They are traders, we are traders and we are here to profit from entering and exiting the market. It's really cute when I hear traders say they're waiting for directional bias before entering a trade. Or wait this and wait that, if you're waiting you're emotional and should not be trading. It's as simple as this, "you can wait for the perfect moment or make the moment perfect". As trader we are not waiting for the price to come to us, we are already in the midst of it all.. stalking, locked and loaded to pull the trigger!
We do not trade ema and you can see why here. Retail traders do this not us.
Why should you follow our profile on TradingView?
Newish* to the community here on Tradingview, this is what is it you can expect from Cryptoplayground.
💡 Consistent Chart Updates
💡 Levels mapped out for a further confirmation into you analysis.
💡 Clean charts that allow you to remain psychologically confident solid & emotionless & Ready to smash these markets 🚀
💡 Short, Mid & Long-term perspectives/setups and position holding guidance
💡 Lessons in the Trade, whether we win or lose we learn 👊
💡 Focusing on High probability setups, zones, signals for every type of trader.
Leave a comment and/or message us on how we can improve and provide better content, we are open to suggestions to create a better experience for you!
💡 Let us know how we can improve and provide better content, we are open to suggestions to create a better experience for you!
Let's catch these moves together! 🤝
BANDUSDT trade ideas


Band plan for short termBand
-The market structure looks bullish on this retracement. Currently it is testing the same area from where it have bounced before.
-I except sweep of the Gap we have around 10.1$
-I want it to get stable here for few days and then we can expect it to bounce but we shouldn't close and daily candle below Monthly open.


BAND USDT LONG SIGNALWe have a downtrend with decreasing volume.
Entry after price breaks trend and blue line.


🔥A good perspective? BAND/USDIf you like the idea, please rate it like it!
# BAND / USD
📌A good perspective? BAND / USD
🔹Analytics: The asset fell by more than 45%, at the moment it is at the global trend line, which has formed since December 31, in addition, the price is also at the local strong support, where, according to the idea, an aggressive buyer will buy the asset. I think BAND is a very good prospect, you won't have to wait long. I do not give exact points for entry-exit. Resistance lines - possible sell / correction, you can fix part of the position. All goals are shown on the chart. This is just my opinion, it may not coincide with yours.

BAND to $33 - Don' miss this opportunity Band is in cup handle with a target of $33, RSI is super low and is ready for another big move

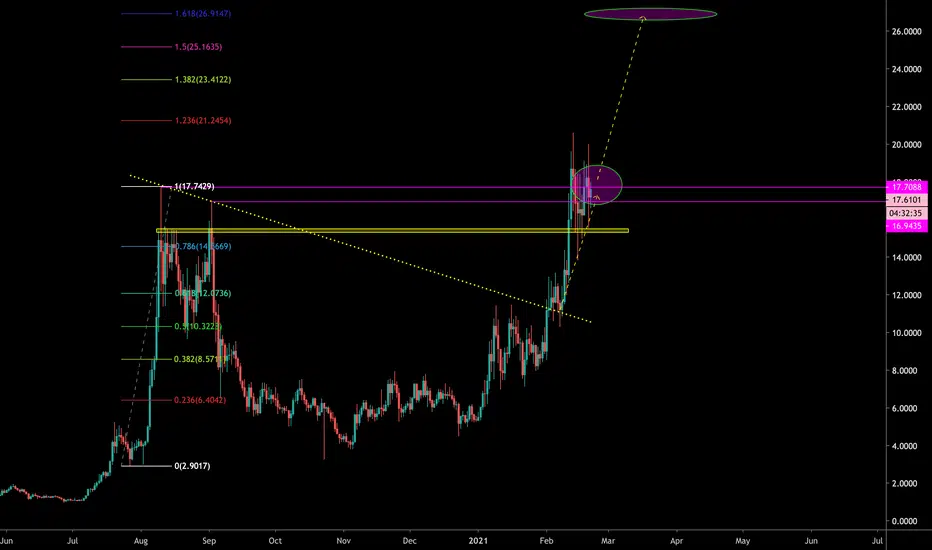
BANDUSDTPERP Huge Cup & Handle on the 1DSeems like a huge cup & handle pattern is shaping for BAND.
Next fib longterm target at around $30.
Like if this caught your interest, looking forward to your thoughts in the comments.

BANDUSDT CUP AND HANDLE PATTERN MOONSHOT AFTER $20
BANDUSDT chart could be forming a nice CUP and HANDLE pattern. A pattern that we seen in my ORNUSDT chart for example.
BANDUSDT broke out to 20$ and lost it's uptrend breakout. We can see a support level forming at the current price $13.
I expect that BAND could form a cup and handle pattern from here on and move back to the $20 level. Once we get to this level, we could expect a further break out to a $25 level.

Knockout performance or a Dud BAND? 21.00 or 15.00Not financial advice.
"How do you respond when it's your time to step up?"
Legalizedhustler
Just an update this is a triangle inside of main ascending triangle I posted from earlier which will be in the notes.
It was right when the trend first started and you will see the similarities and repeat patterns.
The chart in the notes will show nothing where we are at now but keep in mind. The current triangle I highlighted is still 50% higher from the 10.00 range and this one low point is 15.00 now.
Which means we still trading in an upward trajectory with a target of 29.00.
Everything is highlighted.
We either test the high again or lowest part of the triangle.
Also this is the backend of the cup and handle pattern on the 1 day chart that needs to hold above previous all time high of 17.05-17.90 range to complete the handle.
Then you can aim for 35+ overall target
Remember even down to 14.50ish it still in the main ascending triangle so dont get weak hands.
Support the legalizedhustler
#hustlabynature
Soon to be cccllc


Kicked off the stage BAND BOOOO 12.75 must hold or retest 8.00. Not financial advice.
"Don't be naive. It can't go up forever"
Legalizedhustler
Look at previous chart in notes I posted.
That is when band new trend started.
We are still in the ascending triangle that goes to 29.00 long term but if daily today dosent close above 12.75 look for retest off 8.88-8.00
That was the last trendline of support was 8.88 .
But if charts repeat which they usually do.
It'd say we looking at retest of 8.88
I made many references to bitcoin throwing the FU. And having a blowoff top.
This is nothing but a repeat of 2017-2018.
I posted many updates on band and they been pretty accurate. Once my triangle broke before and didn't complete cup and handle pattern.
Why I said set your stop limit at 14.01 in my previous charts. If 14 wouldn't hold I knew 12.50 and 10.50 was next tests.
Market is all over the place. My advice.
Let it settle. Reexamine and enter positions.
Me personally I'm in cash right now. Waiting.
Trade with caution.
Support the legalizedhustler
#hustlabynature

Band to 27$sI was hoping (biased) that the Russians would take a break.... but ...
The Russians are going for it ... Band to 27$s ... maybe even 37$s.
I guess we have 6 to 8 weeks, then chaos.

BAND , longterm gemlets talk about band , serious competitor for chainlinlk with only 376 million dollar marketcap , if bands marketcap reach half of links marketcap price would be around 150$ , i hold a bag as investment

