BANDUSDT trade ideas


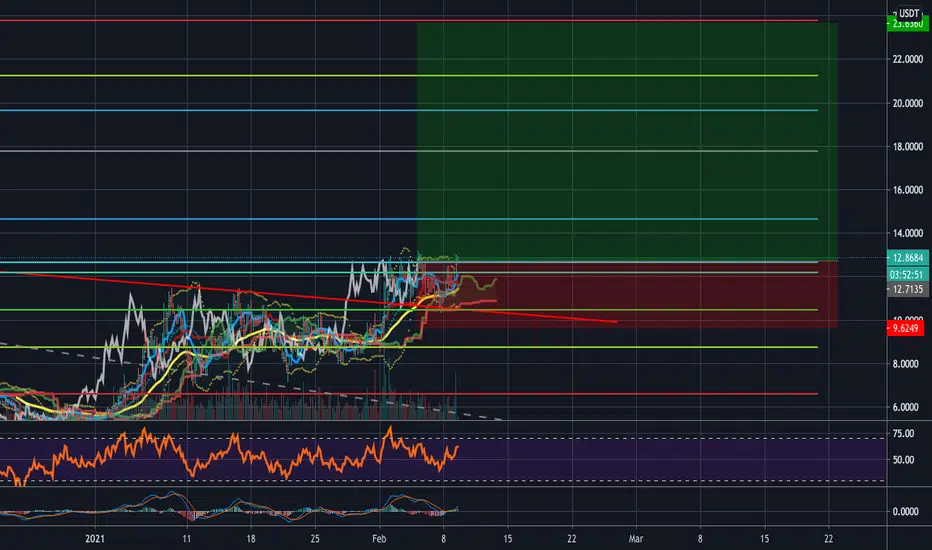
BANDUSDTentry: around 12.8
TP1: 17.554
TP2: 21.08
TP3: 23.63
SL: 9.6249
Check my website for tutorials, examples and calls :)
cry-pto-surf.com


Band protocol projection (long) squeezing up against key levelI predict Band will begin squeezing against the $13 key level. If we see this followed by a breakout Bands next target should be the $15-16.
If price breaks down below $11.4 the idea is invalid and we may spend some more time accumulating before lift off.


Band usdt1 h If break out fibo 0.76 next target is 10 _1.2 but if rejected and break out channel we have first target is 11.7 second 13 and next 18


Band usdtMy god I just can say my god for this chart and target ,
Look at my previous chart for Ada in one week ! I tell you a secret for now band will reach mooooon just one resistant .band will fly

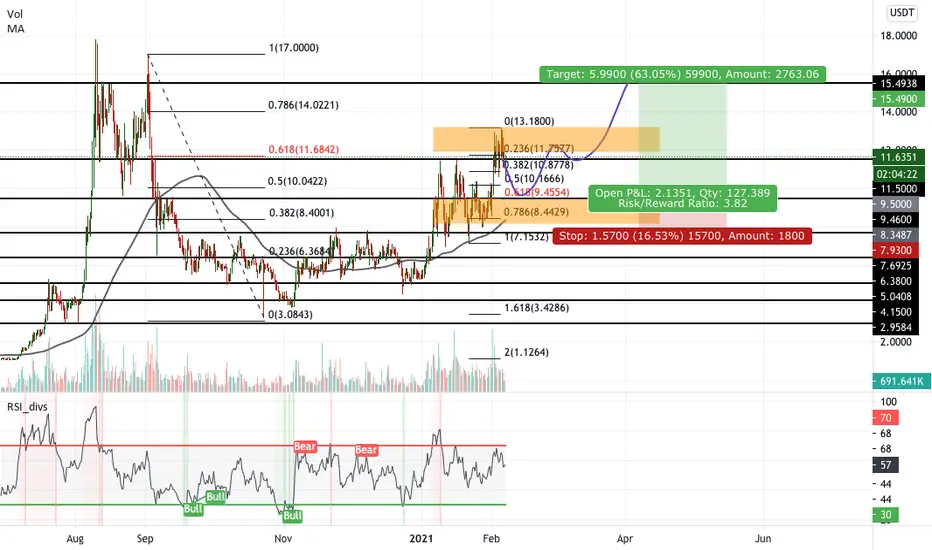
BAND/USDT - Another 63% setup after the correctionHello, Traders!
After an active trading week, the moment of correction is brewing in the market.
We see how the buyers were able to keep the price in their zone of interest between $8.16-9.46.
But from above in the range of $12.00-13.18 sellers are working, which do not allow to pass above their zone of interest.
In case of a correction, we can expect the buyers to defend their position and hence work together with them from buying.
Entry in the deal can be searched in a range of $9.25-9.55.
Stop Loss can be placed under $7.93
Price Targets:
$11.50
$13.15
$14.05
$15.49
Good luck and watch out for the market
P.S. This is not a piece of financial advice but only an idea I would be following myself


BAND update: BULLISH RETEST! GOOD REENTRY!sorry for messy chart, just wanted to get this out there quick.
BAND seems to have found support at the top of the previous ascending triangle it broke out from. It's now forming another ascending triangle (bullish pattern) before it moves higher. Right now the PA is at the bottom of the new pattern, which is the perfect time to reenter / increase position!
Bullish cross on Stoch RSI 4HR - good indication of a move to the upper area of the triangle (possibly higher) soon.
happy trades,
CD


🔥 BAND/USDT Bullish Wedge Break Out: Part 2In my previous BAND post I argued that the break out would lead to a strong bullish move upward. Sadly, the previous idea hit its SL recently. However, that doesn't mean that the trade is invalid. Today's massive candle break out has in my view started a new upward move for this amazing coin.
On the chart I’ve marked two potential areas of resistance, R1 and R2. These areas are based on recent swing highs and round numbers. Do your own due diligence.
Happy trading!

BAND break and retestBAND/USDT is getting ready to boost. Has broken its resistance following with a clear retest and finding strong support at key levels. Aiming for August highs for potential profits.

BAND Starting Parabolic BreakoutBeen tracking band since it was below 20cents.
Publishing this idea to track it's parabolic advance.


BANDUSDT BUTTERFLY BEARISHHi all,
BUTTERFLY BEARISH
The targets of this Formation that I use;
0.50 Fib (TP1) and 1.00 Fib (TP2) levels.
You can use; Your Own Targets, entry point, stop-loss level and cancellation level.
These Formations achieve different success rates on each chart and in each period of it.
If the price goes to its target, Pattern will be successful.
Good luck!

