BAT-BTC : Next stepsHi everybody,
this can be easily sorted to Beyond Technical analysis category.
There is no philosophical background behind this idea, I just played with fibs time zones a little and all past tops pretty fits.
This may be just huge coincidence, but let indicators talk:
MACD: golden cross - bullish
MACD: histogram buy signal
STOCH : buy signal
(dotted lines/gray stripes are daily chart resistances)
Realize that this is 1W chart and If trend remains, next top by fib time zone would be at 02/2020.
This is not a financial advice, do your own research.
BATBTC trade ideas


BAT Daily Chart Analysis 400%+ potential profitsAfter 138 days decline from april highs to septembers low BAT is ready to make some great move.
Ahead of us is the first serious resistance, the level of 0.786 fib 3235-3315 sat. Which is a horizontal stop for buyers, and when approaching it, you should partially fix your positions.

Punting a swing trade on BATLooking at this longer term analysis on BAT,
We've seen a sustained downtrend in the past few months, HOWEVER,
Price point for entry is starting to become favourable
- RSI and MACD divergence detected
- Price is testing the trending support line
Watching for volume and a possible reversal.
Buy volume needs to come in, followed by two main requisites
- Break past previous support (new resistance) at 2160 sats
- Sustain volume past the 50MA

BATBTC - Testing ResistanceBINANCE:BATBTC is testing potential resistance.
I've circled the past support at this current level in the past on the BINANCE:BATBTC daily chart. I'm not quite sure the market is ready for #AltSeason as BITSTAMP:BTCUSD appears poised for a major move soon. The RSI and StochRSI are nearly oversold or are already oversold. The price itself is approaching the 100 day SMA, coincidentally at the same level that might be potential resistance.
While I like the Brave browser and think there is a lot of potential in BINANCE:BATBTC I have a feeling the recent relief may slow down. I'm looking for the RSI and StochRSI to cool down some and hoping the 50 day SMA can hold as support. I think we are close to a bottom, but the huge bullish potential may not be fully ready to transpire.
DISCLAIMER: For educational and entertainment purposes only. Nothing in this content should be interpreted as financial advice or a recommendation to buy or sell any sort of security or investment including all types of crypto. DYOR, TYOB.

BAT/BTCIn 4H Time Frame it Has a Flag Pattern and It Can Break The Flag Line so it Can Rise up to 0.00002037
Targets:
Rise:0.00002037-0.00002150
Fall:0.00001901-0.00001828
But I Think It Can RISE

Volume profileWith volume profile I use Point of Control_ POC to identify areas where I can place a buy/long order: its not perfect but its working well so far!

BAT - Above Trend - Correction? Still above the trend but could still come down lower. Big area for BAT to get out of and needs a big push.

BATBTC: Potential Continuation. Alt Run XRP, ZRX correlation.*Not financial advice*
Previous BAT posts below. Nothing much has changed for long term outlook. There does appear to be upside potentially in the near future due to:
-ZRX, ETH have already completed their double bottom patterns
-BAT AO (momentum) has been diverging for months.
-Volume has finally resurfaced from YTD lows.
-Currently at historic price range lows (check BAT/BTC 1W chart).
Definitely a stop loss trade to manage downside.

BAT/BTC: Textbook Wyckoff Spring? Or more pain ahead?*Idea only. Not a recommendation to buy or sell*
For potential longer term picture, check first idea linked below. Feel free to look at my other posts as well.


Basic Attention Token Next Falling Wedge (300% Profits)Here is the full chart for Basic Attention Token (BATBTC) on Binance, it shows data since November 2017.
We are going to keep it simple today and look at the multiple falling wedges throughout time.
Notice that each time a falling wedge is completed, a new up-wave takes place.
The current falling wedge is the biggest one, which means that it can also produce the best results.
Here we are looking at 300% potential profits based on my calculations, long-term, but it can produce even more.
What are your thoughts?
Please share with us in the comments section below...
Namaste.

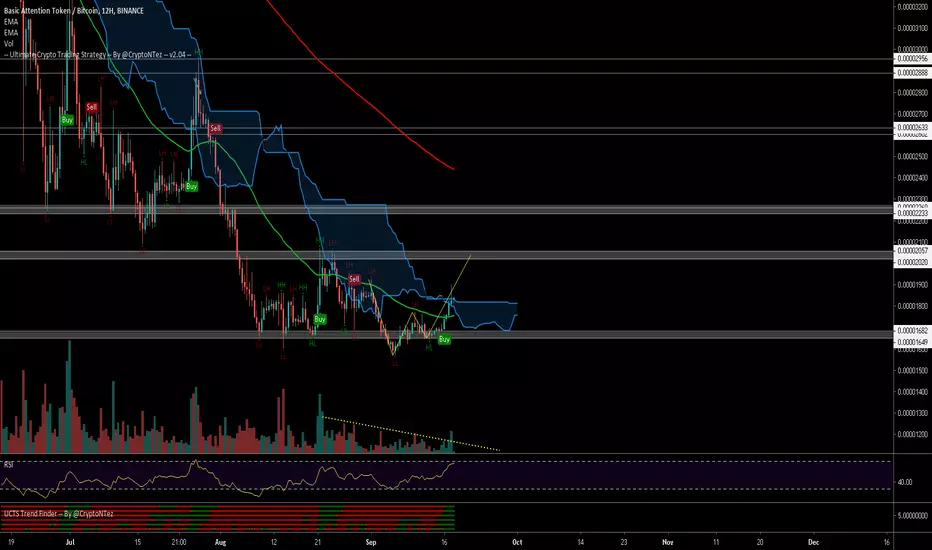
$BAT, W bottom pattern formation in play..$BAT
W bottom pattern formation in play..
Volume flowing in cutting the descending trendline
Crossed above EMA50/ Ichi cloud
UCTS Indicator green on every TF
Aiming for ~2k sats as 1st target from here (10%)
#BAT
BAT/BTC (1D) Bullish SetupRSI shows double bullish divergence. The price is trying to break through the middle of the channel. Looks good. Good luck everyone!

Basic Attention Token (Sept 16) #BAT $BAT #BTC $BTC #USDT $USDTBuy : Close to 1700 / 0.17$
Sell : 1800-1900-2000 / 0.18$-0.19$-0.20$
Mid-Hold : 2700 / 0.27$
Stop : Under 1500 / 0.16$

BAT - Possible Breakout?Once there is some price action, over the EMA34 this could rise up nicely. Good FA and utility within the token make this a good long term investment but as trading goes this could accumulate Bitcoin nicely via a trade.
Wait for EMA34 to support not resistance.


Basic Attention Token Dead ??This coin gave a whopping 180% profit in 2019 Q1.
Since then it is more than 82% down, and at this point, an upward movement is must now or else it will be in the position where ethereum classic is right now


BATBTC Near Resistance if BATBTC break this resistance than Very good profit ...
You can enter in the zone or wait for confirmation
stop loss is 4-5%

BATBTC starting to look good for quick profitsA few caveats here, but BATBTC is starting to look pretty good.
The 4hr is trying to break above the resistance zones around the 1860 sats. IF you are going to play this long position, always make sure that you understand that typically there is a retrace after a breakout. So when we break above the 1860 sats and are also above the 10 and 20 MA, allow it to retrace 1-2 candles. You will want to buy in after the retrace and above the retraced support.
Set your stop loss to the bottom of your retrace candle (plus a little slippage) and enter into a position above support. I would set up a limit order for this scenario and place it once we are above all the MAs. Looking at possibly 2000 sats or somewhere around the aqua trend line for profit.
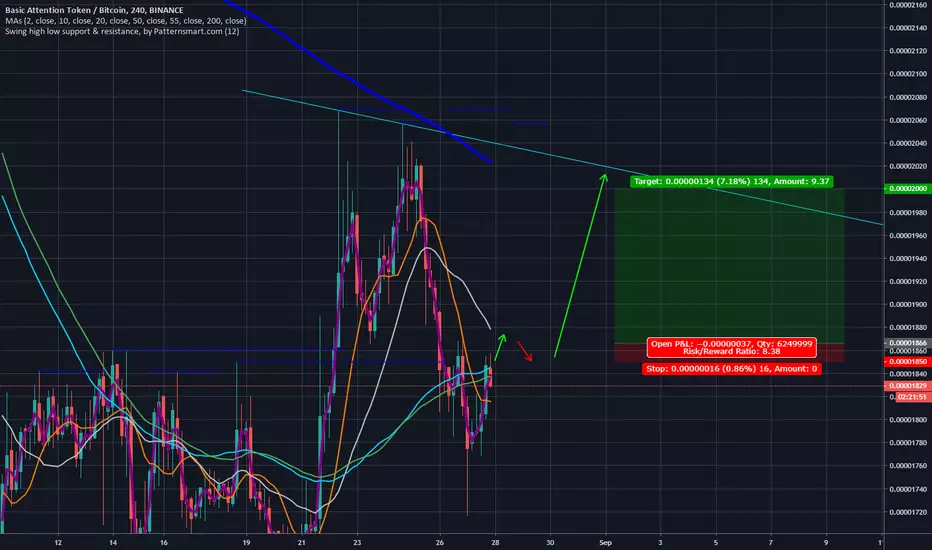
BAT can fly?Hello Traders!
BAT is looking for Robin to make for us some good trade opportunities...
Looking for final confirmations:
Price: succesfull attempt to make a level @0.00002009
DMI - ADX boost needed
AE - positive side green bar
Alligator - ready for eating some candlesticks
Roger out.
