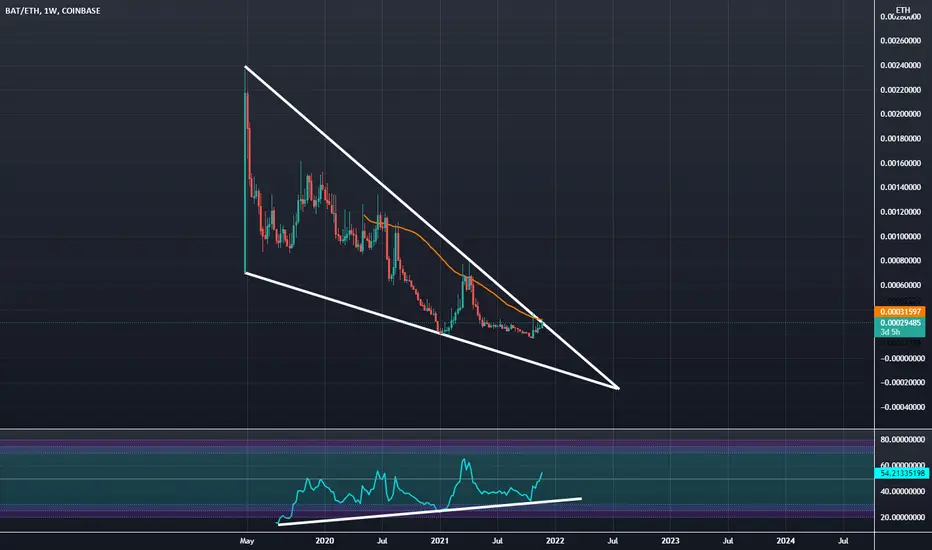
#BATETH - Heading back to All-Time Low Soon?A very strong historic trend line has just been tested and rejected the price once again - but we're already quite near the all-time low of #BasicAttentionToken / #ETHEREUM already.
We can see almost 10% coming off the price quite easily, that's a good profit already, with the potential for over 20
Related pairs

BAT Looks Very Likely to flip ETH Very SoonI uploaded a huge weekly bullish shark pattern on this pair from the Binance chart a few weeks ago that can be seen in the related section and it's since gone up 100 percent and has much more to go. Now i want to share a different bullish perspective on the Coinbase chart. We are in a big falling we

BATETHE 30 min Chart Bullish Divergence, 0.618 Fib, and SupportChart says it all. Go altseason! Hold for longer term BAT break out or flip to get some more ETH


BAT ETH Bullish Butterfly.Just a quick little idea i have recently been reading up on some harmonic patterns and Decided to make this my first call. BAT ETH is showing some bullish divergence on the MACD as it's volume recedes the RSI isn't as clear but BAT is in this potential butterfly pattern i have have 3 potential targe

Weekly Bullish Bat on BAT/ETHLast year i posted a bullish butterfly on BAT/ETH and it very much outperformed our targets it was great. The butterfly was mostly only visible on the 4hr and a bit on the daily.
Well now it seems that the price actin we got out of that has given us a nice much bigger visible on the WEEKLY Bullish


See all ideas
Summarizing what the indicators are suggesting.
Oscillators
Neutral
SellBuy
Strong sellStrong buy
Strong sellSellNeutralBuyStrong buy
Oscillators
Neutral
SellBuy
Strong sellStrong buy
Strong sellSellNeutralBuyStrong buy
Summary
Neutral
SellBuy
Strong sellStrong buy
Strong sellSellNeutralBuyStrong buy
Summary
Neutral
SellBuy
Strong sellStrong buy
Strong sellSellNeutralBuyStrong buy
Summary
Neutral
SellBuy
Strong sellStrong buy
Strong sellSellNeutralBuyStrong buy
Moving Averages
Neutral
SellBuy
Strong sellStrong buy
Strong sellSellNeutralBuyStrong buy
Moving Averages
Neutral
SellBuy
Strong sellStrong buy
Strong sellSellNeutralBuyStrong buy
Displays a symbol's price movements over previous years to identify recurring trends.