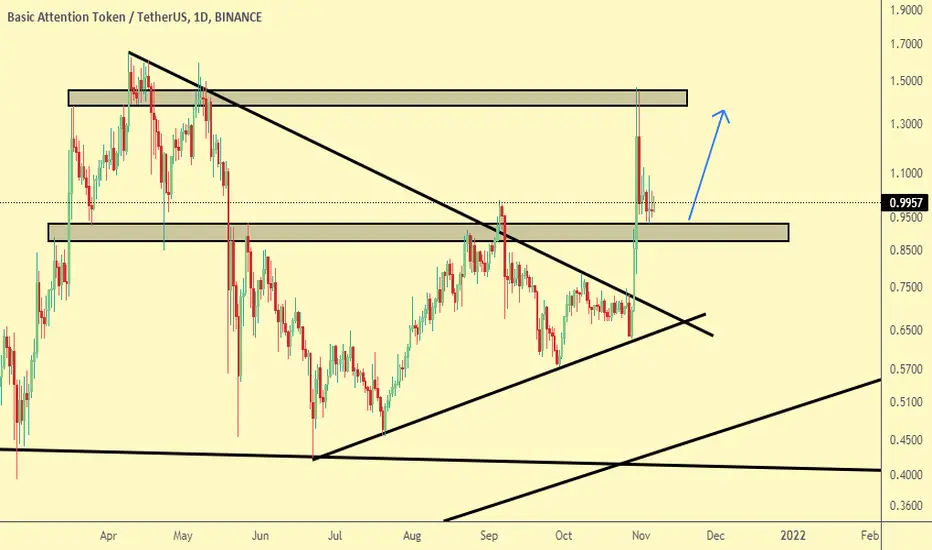
How is BAT(Basic Attention Token) looking?After %100 pumps on such short term, there could be some consolidation between resistance and support areas on the chart. Blue box is created by latest swings of 0.236 and 0.382 levels(fibonacci). The resistance levels(yellow box) are this years low and high's 0.618 and 0.786 levels. Other potential levels taht could play out as resistnace levels are also in the chart as 1.618,2.618 levels etc.
I do not rely on fibonacci levels only as you can see on my charts, I also consider previous price levels to allign them to show you the best options.
If you want some coin to be analyzed by me, please write in the comments.
Have a nice day!
BATUSDT trade ideas

BAT/USDT PERPBat have a bullish bat in tame 4h & have a bullish butterfly in tame 1h if complete pattern open your position .
...............
int:1.05
Sl:0.9426
Tp1:1.1552
Tp2:1.2412
Tp3:1.3900

Long BATUSDTLong BATUSDT
BATUSDT is showing strenght against BTC , im looking to long after a 6H close above previous resistance zone of 1.44
1st target 1.88 zone
2nd Target 2.38 zone
Invalidation day close below 1.08 zone


i need 2 more likes to chat with fellow traders, pls and thanksJust a degen trader wanting to learn and trade from you all.

BAT reached target (result)on the previous BAT analysis the price was about and at the moment the price is 1.21 as we speak which means it experienced 21% profit as of that time.
check the link below to see the previous analysis.


BAT LongI f Bitcoin don't break Bat will go toward 4$
Accumulation in RSI, with strong resistance at 1$ area, will push Bat over pivot points like it was last week bat this time scale is bigger.


#Bat / #Usdt #Spot / #Midterm
❇️Buy zone 1 : 1.0028~0.99
🎯Targets : 1.082 / 1.222 / 1.326 / 1.41 / 1.55 / 1.64
🛑Don't risk more than 3% of capital.

BAT has reached a support levelas batusdt has reached a crucial support level, It seems like a good level to go long
BATBTCAB=CD . C from AB close at 50% and will D close at 200% from BC and now very good chance to buy


BATUSDTHello friends
According to my analysis, the BATUSDT currency has deviated from the triangle pattern on a daily basis and I expect the triangle height to grow to 2.18.

BAT RUN!Hello everyone, if you like the idea, do not forget to support with a like and follow.
BAT is retesting a support zone so we will be looking for buy setups on lower timeframes.

BAT LONGCurrently BAT is in Bull Flag pattern & the support from ichimoku cloud 1h-4h & 1d mostly is same


batusdtbatusdt price action pattren.
order block. if price break 1st order block zone then price will continue fall for mitigate 2nd order block zone

🔥 BAT Potential Third Wave Incoming: Fibonacci AnalysisBAT has seen a massive >130% move over the last few days. However, BAT has been bleeding value since hitting the top around $1.46.
The Fibonacci retracement tool is a great tool to scout potential areas of reversal. For BAT, I'm looking at the pink Reversal Zone for a potential bounce.
The bounce can take us either towards the local top, or can stop somewhere in the middle to form a triangle pattern of some sort. I'm looking at the area between $1.25 and $1.40 for an exit.
Happy trading!

₿ BATUSDT 1D ₿ : 31.Oct.2021 (+106%) 🚀As you can see, since the introduction of this CryptoCurrency, its price has grown by more than 106% ... It is now moving towards the previous ATH. If a new ATH is registered , the analysis will be updated ...
Follow our other analysis & Feel free to ask any questions you have, we are here to help.
⚠️ This Analysis will be updated ...
👤 Arman Shaban : @Ar_M_An_4
📅 31.Oct.2021
⚠️(DYOR)
