Basic Attention Token / Tether (BATUSDT) Daily swing tradeHi
here is another BAT analysis based on different Fibs confluences which are retracment, projection, and extensions and TP zone is specified with Fib time Base
please comment me your opinions.
thanks
BATUSDT trade ideas


BATUSDT - EW analysis - ABC zigzag down BATUSDT - It seems like wave B finished within ABC zigzag down. The C wave is in progress. If the price crosses above 0.2558, then it may extend the B wave correction in complex fashion. But overall the bounce will be sell for C wave down.
Give thumbs up if you really like the trade idea.

BATUSDTPERPBAT is great for scalpers in lower than 10x for now in long position but if an of the minor supports breaks this forecast is failed but it most probably as we checked is the scenario of BATUSDTPERP for scalpers which can get a fortune due to your R/R
the green line is the most probable resistance has to be touched/tested just careful about it nothing else can hold this bullish trend that much

BATUSDT - EW analysis - ABC zigzag down BATUSDT - It is in ABC zigzag down from the major top. The B wave is in progress as abc zigzag as internal count. Thereafter expecting C wave to go down.
Give thumbs up if you really like the trade idea.

BAT/USD : Breakout + Retest + Buy pressure candleKRAKEN:BATUSD
Hello everyone 😃
BAT had a breakout from Bearish trendline and now it's facing Resistance zone.
Indicators are showing Bearish crossover but overall is Bullish.
Recommend to buy on this zone or on retest at lower supports, Targets are Mentioned on chart.
Attention: this isn't financial advice we are just trying to help people on their own vision.
Have a good day!
-Helical_Trades

$BAT - $0.40 fOR 2021? Basic Attention Token price is forecasted to reach $0.41 by the end of the year.
In 2021, the BAT coin price will be $0.44.
In 2022, the price of one BAT coin will be $0.48.
By the end of 2023, BAT coin price will reach about $0.55.

Maybe it moves like this :))We are currently in the support area .... We expect the price to return above this range ...
If this range is lost with the fall of Bitcoin, the range of the desired support box will raise the price...

BAT/USDT- Potential to break long term resistanceWatching BAT closely for the next few days. Could be a pump not to be missed.
Some positive press this week has highlighted this project again and with the long term resistance potentially about to break we could see some excellent gains over the coming days.
Last time we broke this level we ran for about 50% gains but prior to that the .2830 has long been the resistance point.
This market however is on more bullish.
Prefer the lower entry but will personally consider the break entry if we see a 4hr candle close above- (don't trade the long wick only)
As always, not financial advice, just my thoughts and TA- DYOR!
Breakout entry's are always higher risk so trade within your means.
Bingaz.


Buy BAT/USDT Target Approximately ~60%BAT is looking good here. Breakout and retest. Target Approximately 20-60%

BAT Weekly Technical Analysis. My fellow Traders
Encountering an important resistance zone, this pair is trying to test the tops of the ascending and descending trend lines above. The blue levels could serve as midterm targets provided that the resistance zone is conquered. We need to wait for the weekly candle though.
Goodluck everyone.


BATUSDT - Daily analysis BATUSDT retested the flip descending trendline support + 0.618 fibonacci retracement level.
Price brokeout above the ascending triangle inclined resistance.
RSI printed a bullish divergence signal.
Possible uptrend ⬆️.
Targets 🎯 - horizontal resistance levels.
Setup invalidation ❌ - breakdown below the swing low.

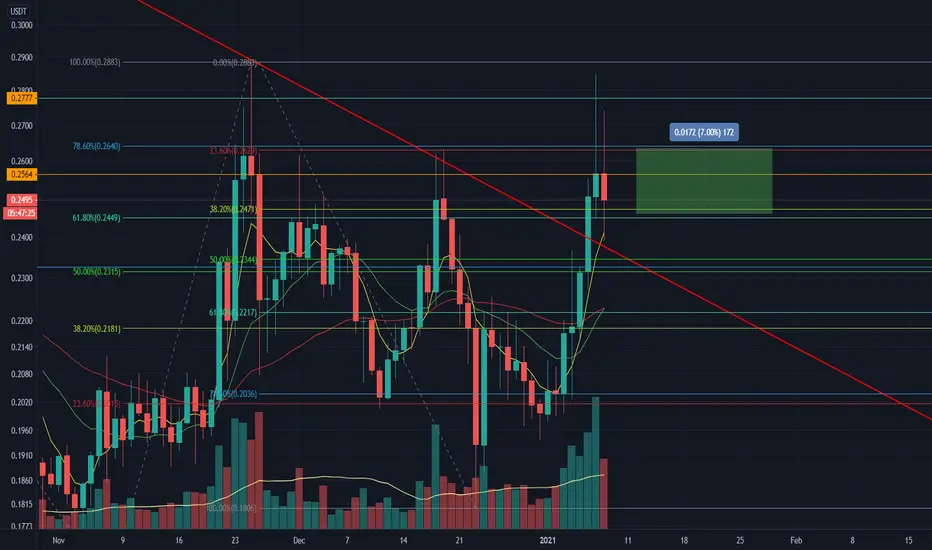
BAT in daily timeframe AND 7% Profitv !BAT in daily timeframe AND 7% Profitv !
Long BUY and HOLD is recommended.
Long-term BAT analysisLong-term BAT analysis
In case of fall, it can go to the bottom of the canal, which causes 11% loss.
If it grows, it can go to the middle of the canal in the first step, which is 65% profit.
Good luck and profitable.

BAT/USDT - Weekly Chart - Next Target 0.60$Good Morning!
What can happen within a week or two weeks? i don't worry too much about daily price fluctuation actually.
Think one of the best Crypto's to swing trade is BAT.
125% pump is definitely possible
Daily break out, small pullback first before it will go higher.
I keep my eyes on BAT!
Let me know what you think!
Kind Regards Robin.

The popular BAT currency is in a good position.The popular BAT currency is in a good position.
According to the chart, you can see that the multi-month downtrend line has broken well.
The first resistance in front of it is 0.2777, which it touched today (the same orange horizon line as the first color).
If it breaks again in the 4-hour timeframe and stabilizes above it, you can enter and wait until the next orange line.
It will make about 15% profit.

Long after breaking long term trend20m users, solid product, long term team. What’s not to like about this modestly traded coin.


Crypto|BAT/USDT|LongLong BAT/USDT
Activation of the transaction only when the blue zone is fixed/broken.
The idea is the usual one for breaking through the local levels of the triangle.
Blue zones - activation zones.
Green zones - take zones.
The red zone - the stop zone.
Working out the stop when the price returns to the level after activation + fixing in the red zone.
Orange arrow - the direction of take.
Blue arrow - neutral scenario without activating the trade.
The red arrow - the direction of the stop.

Accumulating $BAT daily. Imminent break out to .30Been accumulating a lot of $BAT daily - .30+ soon. Daily Fibonacci confluence with monthly Fibonacci setup. Volume picking up, EMA 50 curving upwards heading towards EMA 200 golden cross.. break out soon. Buy and HODL, patience is all it takes. BAT will be a performer in this bull market.

