BatusdtTime to rise up bat
If bat can breaks 0.222 we can hope to reach 0.26$ and 0.29$ levels .movement is a little bit slow . But if btc.d is red and totally goes green . We will see good move of batusdt
BATUSDT trade ideas

batIn the weekly timeframe, such a pattern may be noticeable. The orange circle is the micro-movement shown below.

Finally Bat Breaking out Bat breaking falling wedge In htfs Incase Of successful Breakout expecting Massive bullish rally in Midterm Incase Of successful Breakout expecting Move towards 0.70$


BAT, Imminent Price Growth after weekly breakout!BAT recorded significant net buying / accumulation this past few days warranting a +40% surge on its recent low from 0.15 to the current range at 0.21.
On weekly data histogram, the coin registered higher lows -- where the gap between the last histogram "shift" and the last one was 6 months (last January 2023). This is a huge hint of a reversal. A weekly descending trendline has been broken conveying a turnaround season for the coin.
Pricewise, it is sitting at a 1.0 FIB level, this is beyond bargain / discount already. The range is currently hovering around a 3-year long standing strong support. Expect some significant price growth from here on.
Spotted at 0.20
TAYOR.
Safeguard capital always.

BATUSDTWeekly currency analysis
Ascendant sign
does not have
What we mean by climbing means being targeted by H.H
So we are waiting for this currency in the sales order block
Or buy at Orderblock Xtremem
If you get confirmation of the climb to buy
Smart Money
Hunter
Liquidity

Short
Dummy text
In this video, I hosted Mikey Again and we talked about his crazy dropshipping journey. If you are interested in learning about Shopify dropshipping or you have recently started your own dropshipping business, then you should definitely watch this video. Watch the whole video and apply tips and tricks from it on your way to becoming a successful dropshipper.
🎓 🎓 Apply for a free consultation session with me personally
Drop a comment below if you’ve got any questions, feedback, or videos you’d like to see in the future! I’d love to know.
Do you want to build your own successful online store?


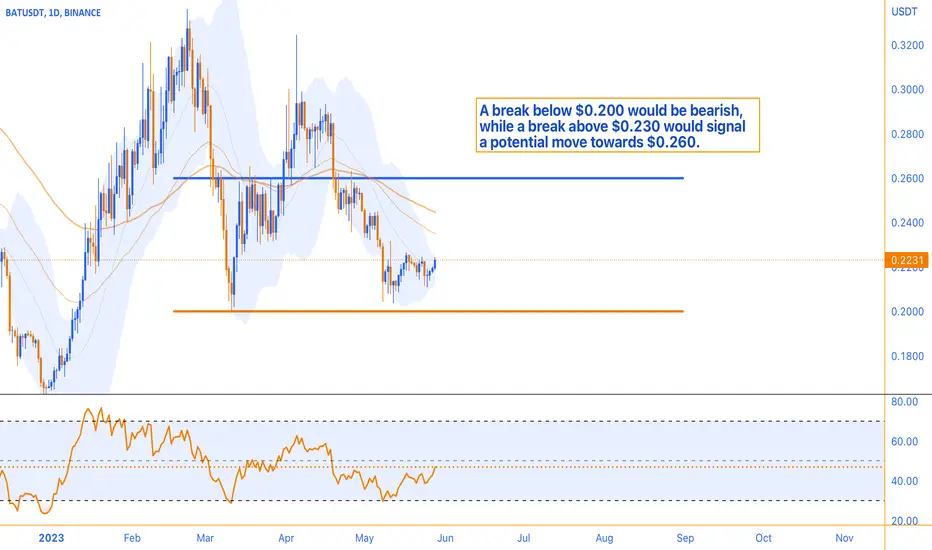
Range-bound Price with Impending BreakoutThe current price exhibits a consolidated trading pattern, confined within a narrow range, indicating an imminent breakout on the horizon. As we delve into the technical aspects, it becomes evident that the market's primary support rests at the $0.200 level. A breach below this crucial threshold would herald a distinctly bearish sentiment, triggering an atmosphere of pessimism and potentially paving the way for further downward movement.
Conversely, the formidable resistance level at $0.230 presents a significant barrier for the price to overcome. A successful breakthrough beyond this resistance would signify a notable bullish momentum, propelling the price towards the promising territory of the $0.260 range. It is prudent for market participants to exercise patience and vigilance, closely observing developments at the support zone and monitoring any potential breakthrough above the $0.230 level.
Adding to our analysis, the Relative Strength Index (RSI) currently registers at 47, indicating a moderate level of momentum in the market. With RSI serving as a valuable tool for assessing price strength and speed, this reading suggests a balanced market sentiment without significant overbought or oversold conditions prevailing.
Considering all these factors, it is crucial to adopt a comprehensive approach to decision-making, integrating the analysis of price action, support and resistance levels, as well as the RSI. By harmonizing these indicators, traders can gain a more holistic understanding of market dynamics, allowing for well-informed entry and exit strategies.
Shortwhy my bluetooth speaker making noise when pluggedwhy my bluetooth speaker making noise when pluggedwhy my bluetooth speaker making noise when pluggedwhy my bluetooth speaker making noise when plugged

bat usdt 4h chartbat usdt 4h chart
falling wedge forming at support zone (trendline and support)
short term long may happen according to blue arrow

BATUSDT SHORTBATUSDT SHORT
My first idea in tradingview.
Random:
Users can optionally enable "Historical Polarity Changes" labels within the settings menu to see where breaker blocks might have provided an effective trade setup previously.
The "Historical Polarity Changes" setting is disabled by default & is most effective using replay mode as the labels are backpainted.
The order blocks & breaker blocks themselves can be used in real-time as they are detected based on the swing length & previous breaker blocks being mitigated.

Batusdt try breaks out of triangle If batusdt breaks in 4h tm above the 0.30$ & 0.34$ zone we have a good pump of it . Like what chart says

BATUSDT - 1h - Bearish IdeaThe advancing trend did not continue as a LH was formed.
Additionally, we can see a bearish candlestick patterns:
Bearish Engulfing
Indicating the start of a declining phase.

BATUSDT - Parabolic Fractal +740%🦇Hi Traders, Investors and Speculators 📈📉
Ev here. Been trading crypto since 2017 and later got into stocks. I have 3 board exams on financial markets and studied economics from a top tier university for a year. Daytime job - Math Teacher. 👩🏫
For the longer term , Basic Attention Token is another altcoin I am extremely bullish on - and it's currently trading in an ideal accumulation zone ! What I expect for BATUSDT is similar to a scenario that played out in November 2020 - April 2021. Notice that this occurs over a longer period, where the price of BAT went from $0.16c parabolic to $1.64 at its highest point. Therefore, the price must first fall lower towards the bottom of the support zone where there is a large demand zone . In other words, DOWN first, then UP.
Interested in Litecoin / LTCUSD ? Check out this idea, which is currently playing out 👀
Why LTCUSDT Can Increase Another +50% 📈
_______________________
📢Follow us here on TradingView for daily updates and trade ideas on crypto , stocks and commodities 💎Hit like & Follow 👍
We thank you for your support !
CryptoCheck

Batusdt Channel Range Batusdt
Attempting Breakout Incase of successful breakout i am expecting 30-50% bullish move
Wait for confirmation & always manage your risk and trade with your own resreach

BATUSDT 2H HR MTBAT
Breaking the strong downtrend of the past
The beginning of the Roman wave with correction in the area of 0.618
Formation of two valleys pattern
TP
Move up to 1.27 Fibonacci high

BAT on strong resistanceBAT testing descending channel resistance on Daily Timeframe
Wait for breakout and retest on smaller Timeframes for Bullish move

BatUsdt long setup for massive runBat is is currently reacting to its 0.5 pullback on weekly chart after breaking trend line.
I expect a massive run towards targets
My second entry is also marked on chart.
Lets see

✴️ Everything Bullish | Basic Attention TokenThere are so many bullish charts that I don't know which ones to post...
It feels kind of surreal but it happens like clockwork every few months.
BATUSDT getting ready to grow.
Namaste.

BATUSDT // cup handle formationWe need closes above 0.3369 Note the wedge resistance in the monthly slice.

BINANCE: BAT/USDT (a clean break out)Hi Bitchargians,
The Basic Attention Token (BAT) was created by the co-founder of Mozilla and Firefox, Brendan Eich, to improve the security, fairness, and efficiency of digital advertising through blockchain technology. It is the native token of the Brave web browser built on top of Ethereum (ETH). we already know this project is growing good but despite all the positive vibes around it chart looks amazing too.
Price successfully reclaimed MA20,50,100 and 200 in daily timeframe and successfully broke above local resistance at 0.26$. a successful retest of this area will be a good sign for next impulse wave.
🛒 Pair: BAT/USDT 🛒
== SPOT==
⏰ 1402/01/12 ⏰
🕰 01.04.2023 🕰
Duration:
📈 SHORT - MID 📈
Ex: Binance
#112
🛒 Buy : 0.26 - 0.27 🛒
👉Sell Targets👈
🎯TP1: 0.285 🥉
🎯TP2: *** 🥈
🎯TP3: *** 🥇
🎯TP4: *** 🚁
🎯TP5: *** ✈️
🎯TP6: *** 🚀
⛔️ SL: 0.224 ⛔️

BATUSDT 15m Good luck
Please note that this is a personal opinion and you should always analyze it yourself
