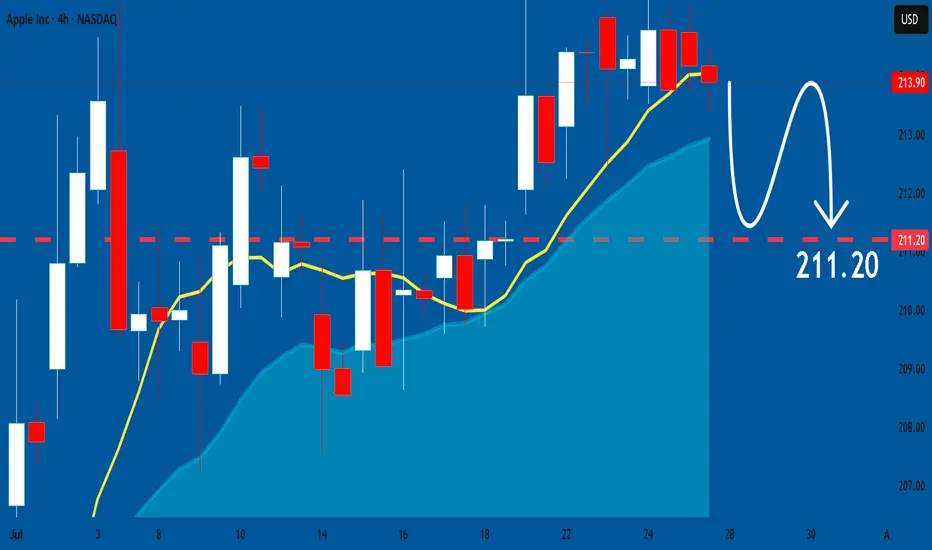
AAPL: 202.38Bullish Entry: 206.00 / 208.00 Stop 202.00 Bullish Target: 210.00 / 213.00
Bearish Entry: 200.00 / 198.00 Stop 202.00 Bearish Target: 196.00 / 194.00
AAPL trade ideas

AAPL EARNINGS TRADE SIGNAL (JULY 31)
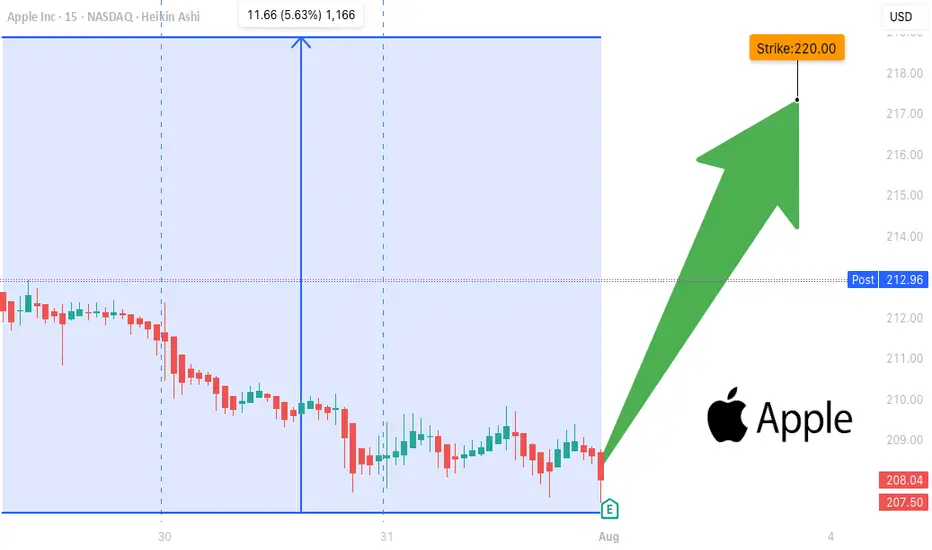
### 🍏 AAPL EARNINGS TRADE SIGNAL (JULY 31) 🚀
📊 **AAPL Call Play** — Earnings Strategy
🧠 Multi-model conviction: **75% Bullish Bias**
---
### 🔍 Fundamental Drivers
✅ TTM Revenue: +5.1%
✅ Gross Margin: 46.6%
✅ 8 straight earnings beats
⚠️ Sector shift: growth → value = caution
📉 TTM EPS Est: \$8.31 (+29.4% growth est.)
🧮 **Score**: 8/10
---
### 💰 Options Flow Breakdown
🔥 IV Rank: 0.70
🔵 Bullish OI @ \$220C = 25,950 contracts
🔻 Skew: Heavy puts @ \$197.5 / \$200
⚠️ Gamma squeeze possible near \$220
📈 **Score**: 8/10
---
### 📉 Technicals
📍 RSI: 39.3 (Oversold)
📉 Trading below 20DMA (\$211.64)
🟥 Low volume pre-earnings = low conviction
📌 Support: \$207.5 | Resistance: \$220
📉 **Score**: 6/10
---
### 🌐 Macro Setup
⚠️ Supply chain pressures
⚠️ Regulatory risk ongoing
🔄 Growth → Value rotation still underway
🌐 **Score**: 5/10
---
### 🧠 Trade Setup (Call Option)
* 🎯 **Strike**: \$220
* 💵 **Entry**: \$0.87
* 📅 **Expiry**: 08/01 (2DTE)
* 📈 **Target**: \$2.61
* 🛑 **Stop**: \$0.43
* ⚖️ **Risk**: 2% of portfolio
* ⏰ **Timing**: Enter before close, report after market
🧮 Expected Move: ±5.0%
🔒 Confidence Level: 75%
---
### ⚙️ Exit Plan
✅ Profit: Exit @ \$2.61
❌ Stop: Exit @ \$0.43
🕒 Time Exit: Force close within 2 hours post-earnings
---
📣 **EARNINGS SCALP PLAY**
— AAPL is oversold w/ strong EPS beat history
— Bullish OI stacking at \$220
— High gamma setup, low IV risk = 💥
\#AAPL #EarningsTrade #CallOption #TradingView #0DTE #OptionsFlow #GammaSqueeze #UnusualOptions #AppleEarnings #SwingTrade #TechStocks
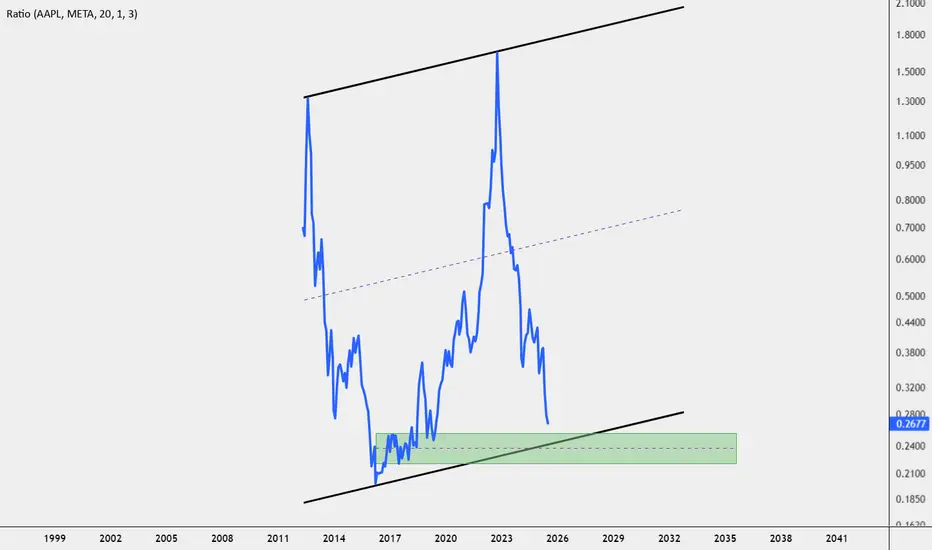
APPL/METAHi every one
You should gradually sell Apple and buy Meta.
From now on, I will call this type of analysis inter-market analysis.
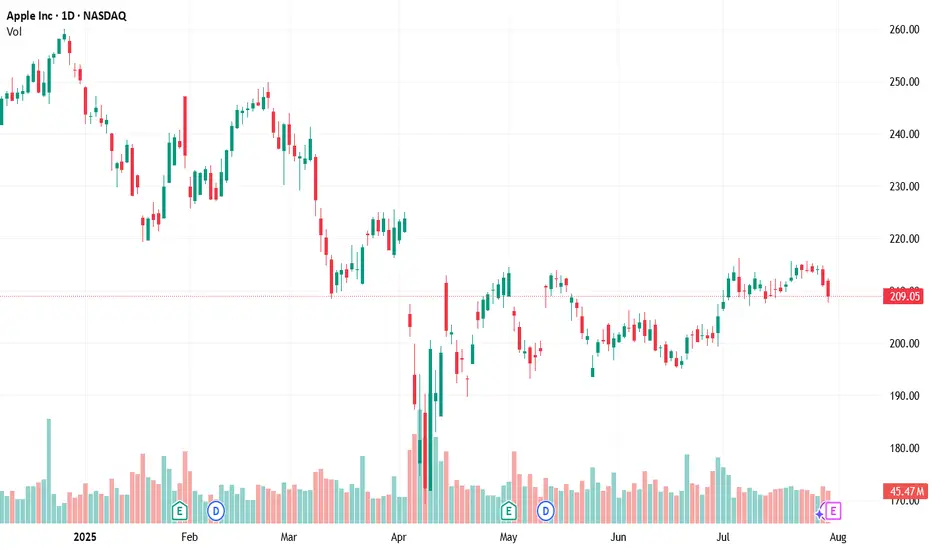
Apple Is Down YTD Ahead of Earnings. What Does Its Chart Say?Apple NASDAQ:AAPL will report earnings Thursday at a time when the tech giant has been struggling more than most other "Magnificent Seven" stocks or higher-end, AI-focused companies. What does fundamental and technical analysis say about AAPL heading into the report?
Let's see:
Apple's Fundamental Analysis
Apple was down 14.4% year to date as of Friday's close, while the S&P 500 was up 8.6%.
Meanwhile, fellow Mag-7 members Nvidia NASDAQ:NVDA and Microsoft NASDAQ:MSFT -- the only publicly traded U.S. companies other than Apple with more than a $3 trillion market cap -- are up 29.2% and 21.9%, respectively.
AAPL has lagged largely because the consumer-electronics giant has dragged its feet on innovation, as well as on the great chase into the world of generative artificial intelligence.
Readers might recall that back in early May, Apple's board increased the firm's dividend payout and authorized a whopping $100 billion share-repurchase program in an attempt to attract investment. But so far, that hasn't seemed to impress Wall Street much.
As for Apple's upcoming fiscal Q3 earnings, the Street is looking for the company to post $1.42 a GAAP EPS of $1.42 on some $89 billion of revenue.
That would represent 1.4% earnings growth and 3.7% better revenues from the $1.40 EPS on $85.8 billion of revenues that the iPhone maker reported in the same period last year.
If this sounds like weak growth, it is. Apple saw 6% year-over-year growth during fiscal Q2 2025, as well as 4.9% in fiscal Q3 2024.
In fact, 20 of the 29 sell-side analysts that I found that cover AAPL lowered their earnings estimates lower for the fiscal Q3 since the period began. (Five have boosted their numbers, while four have made no changes.)
Apple's Technical Analysis
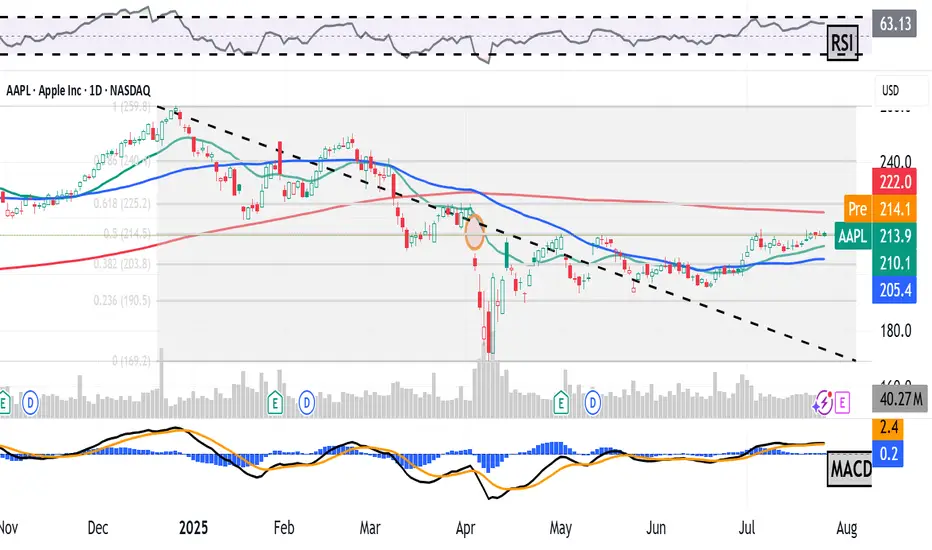
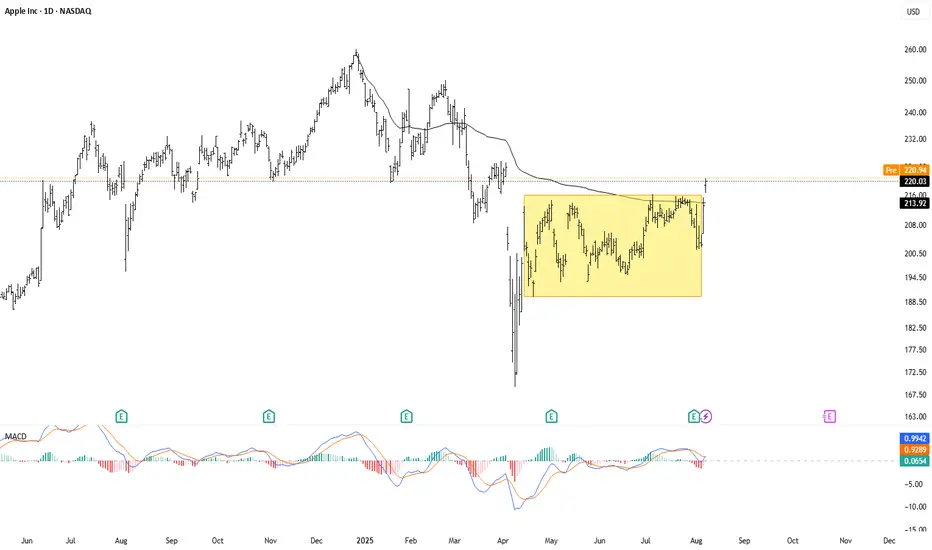
Now let's look at Apple's chart going back to November:
Readers will see that the stock appears to be at a crossroads.
On one hand, Apple developed a "triple-top" pattern of bearish reversal beginning in early May, as marked with red boxes at the above chart's right.
A triple top occurs when a "double-top" pattern fails and a stock retests its resistance from below for a third time.
However, we can see at the chart's extreme right that AAPL has just about reached its resistance level for a fourth time.
What now? Often when someone knocks on a door often enough, that door will open.
Perhaps even more interestingly, we can see that Apple's roughly $215 resistance level (vs. the $213.88 AAPL closed at Friday) appeared at almost precisely the 50% retracement point of the stock's December 2024-April 2025 sell-off.
Note that while they're included with most Fibonacci retracement models, 50% retracements aren't true Fibonacci levels. They are their own thing, but just as technically noteworthy.
All in, Apple now has two potential upside pivots.
One would be the break above the apex of the pattern that's in place. The other would be Apple's 200-day Simple Moving Average (or "SMA," marked with a red line above.)
That creates a potentially bullish set-up. Apple could see support from both its 21-day Exponential Moving Average (or "EMA," denoted with a green line above) and from its 50-day SMA (the blue line above). That's likely where we'll find out if professional managers are willing to defend the stock.
Meanwhile, Apple's Relative Strength Index (or "RSI," marked with a gray line at the chart's top) is robust, but not in a technically overbought state.
Similarly, the stock's daily Moving Average Convergence Divergence indicator (or "MACD," denoted with black and gold lines and blue bars at the chart's bottom), has a bullish look to it, but not overwhelmingly so.
The histogram of Apple's 9-day EMA (the blue bars) is above zero, which is historically a short-term positive signal.
Additionally, both the 12-day EMA (black line) and 26-day EMA (gold line) are above zero, with the black line above the gold line. That's traditionally a short- to medium-term positive signal as well.
Still, it's what happens at that fourth top in the above chart that will likely decide Apple's fate technically.
(Moomoo Technologies Inc. Markets Commentator Stephen “Sarge” Guilfoyle had no position in AAPL at the time of writing this column.)
This article discusses technical analysis, other approaches, including fundamental analysis, may offer very different views. The examples provided are for illustrative purposes only and are not intended to be reflective of the results you can expect to achieve. Specific security charts used are for illustrative purposes only and are not a recommendation, offer to sell, or a solicitation of an offer to buy any security. Past investment performance does not indicate or guarantee future success. Returns will vary, and all investments carry risks, including loss of principal. This content is also not a research report and is not intended to serve as the basis for any investment decision. The information contained in this article does not purport to be a complete description of the securities, markets, or developments referred to in this material. Moomoo and its affiliates make no representation or warranty as to the article's adequacy, completeness, accuracy or timeliness for any particular purpose of the above content. Furthermore, there is no guarantee that any statements, estimates, price targets, opinions or forecasts provided herein will prove to be correct.
Moomoo is a financial information and trading app offered by Moomoo Technologies Inc. In the U.S., investment products and services on Moomoo are offered by Moomoo Financial Inc., Member FINRA/SIPC.
TradingView is an independent third party not affiliated with Moomoo Financial Inc., Moomoo Technologies Inc., or its affiliates. Moomoo Financial Inc. and its affiliates do not endorse, represent or warrant the completeness and accuracy of the data and information available on the TradingView platform and are not responsible for any services provided by the third-party platform.
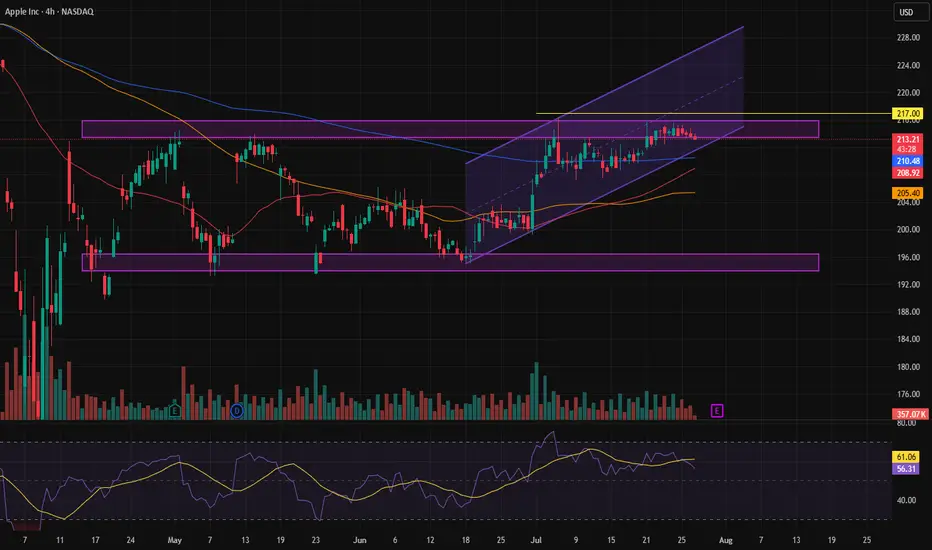
AAPL/SPY ratio + AAPL Weekly Triangle TradeIn this video I cover the weekly Triangle pattern, with explaining my current trade and what moves I am prepared for. I also cover the AAPL/SPY ratio chart and why this may be useful when trading AAPL.

Live data chart
A technical analysis summary (moving averages, RSI, MACD, etc.)
A fundamental snapshot of Apple (revenue, EPS, P/E)
APPL, Get Yourself a Good PriceHello This week we are breaking down the MAG7 starting with Apple.
This analysis is an aid to help you:
1 Find good price to add to your long term.
2 Hedge your current position.
3 Make a swing trade (we will touch on options pricing as well).
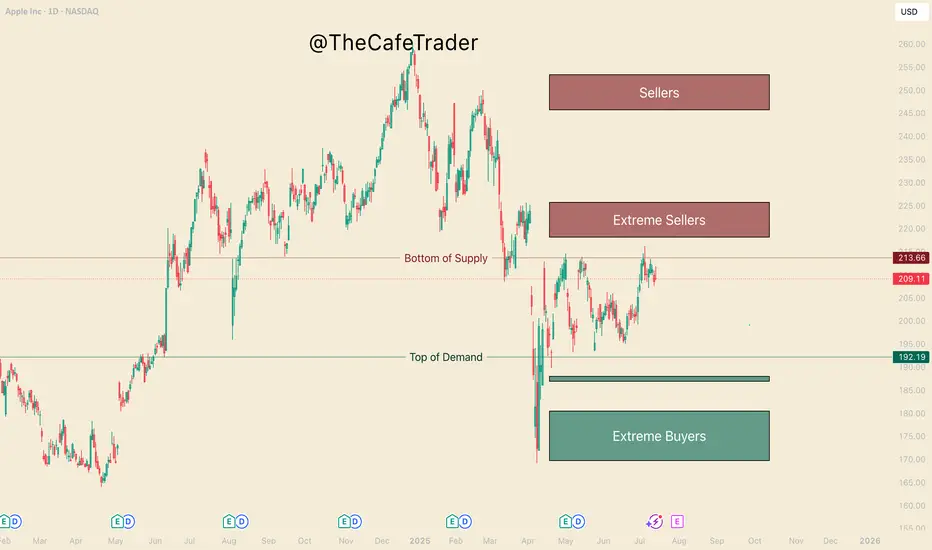
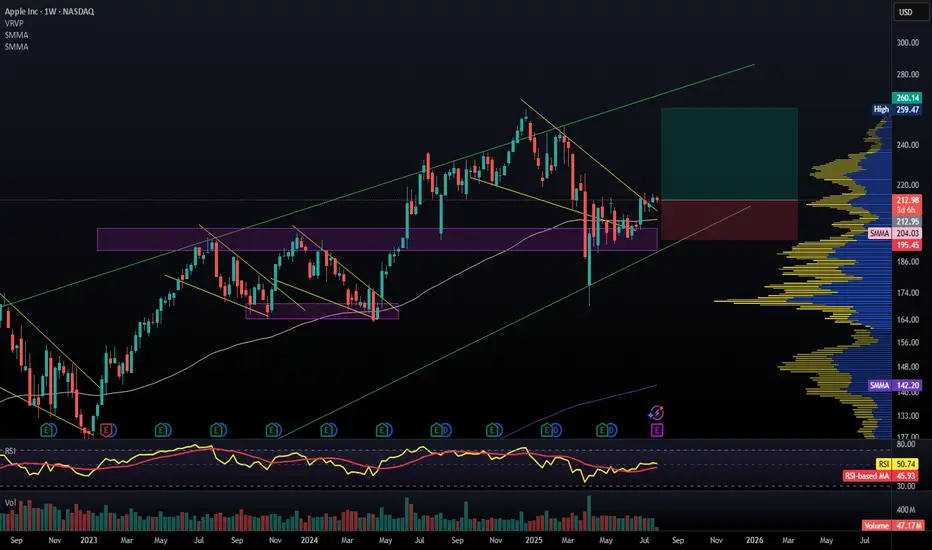
Currently Apple is 1 of 5 of the MAG 7 that had not gained a new high since Trump and the tariff scares. Many analysts have given their predictions on where Apples fair value lies and these vary. What they will not tell you is where the institutional buyers and sellers are. Not to worry, this is where we come in
Big Buyers and Big Sellers
On the chart in front of you, take a look at the 3 different buy and sell zones (otherwise known as supply and demand zones). We find these areas in using a system similar to "imbalances" if you are familiar with the footprint chart, or orderflow. If you had no idea what any of that means, not to worry, I've done the work for you.
-The lines represent the fringe of real liquidity . Using this we will be able to help you find how and when you can find a good price for your long term.
- Buyers/Sellers: strong motivated liquidity.
- Extreme Buyers/sellers Extreme demand, this is an area you could consider a steal.
1 How do you find good pricing?
Simply put - Buy with the buyers and sell with the sellers.
If you are wanting to add to your long term here are the prices. Do you want to get in ASAP? or are you willing to wait for what could be a great deal. This is important as the end of the year can greatly depend on not just picking a good stock, but finding a great price.
Buying
Fair - 192
Good - 188-187
GREAT - 180-169
Now if you are in, and maybe you want to hedge the downside (you can do this by shorting the stock, or buying put options (even more in depth you can do spreads).
For now we will just focus on Buying Put options and taking profit for swing traders.
The Burgundy line "bottom of supply" previously rejected this area twice before (May 1st, and May 14th). July 7th marks the 3rd rejection. It's important to note that the last test pushes a new high, this shows a bit of weakness from the sellers.
This weakness suggests we may see the 218-225 Sellers get tested before it comes down. The question is, How strong will the buyers be coming into this zone.
If they are aggressing this area with new REAL buyers, Then we may see this run through all these sellers and continue to run until the 245 area. If we do not find real buyers here, then likely we will reject to the pricing marked previously.
If you are holding APPLE, you can look to hedge with puts at the end of the 220-223. Since you are looking at about 5-7% downside from apple if the sellers are strong here, look to only spend 2-3% of your apple worth on puts. look for maybe 2-3 weeks out if possible.
Secondly if APPL does make a bull run to 245 you can mark this area again to hedge short term puts. look for 8-10%+ downside puts 3-4 weeks out (roughly 3-5% of your apple size)
Hedging can be very useful in wanted to keep your long term and navigate some of the ebbs and flows of the market. Notice that the risk of your puts, 2-3% & 3-5%, is half of the expected reaction from these areas. if you get a big rejection, expect these options to pay well.
NOTE: If you do not understand the implied volatility (IV's) change the price of options, it is recommended that you stay away from options until you have sufficient experience. It's also important to know how to find a good strike price, and how to know if you are getting a good price. I will be breaking down options pricing in a different time.
That's all for Apple, Stay tuned for the rest of the MAG 7!
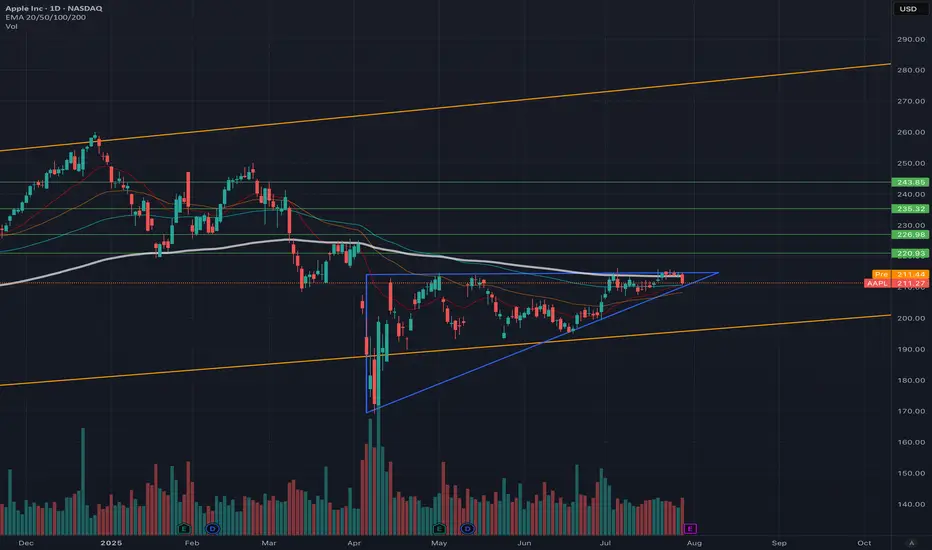
Ascending Triangle APPLE! Could be a big move up soon?!Very short technical idea. Apple could be forming a massive Ascending Triangle Pattern, which would be super bullish for this Magnificent 7 stock. It could also be looking to break soon!
It's a bullish continuation pattern, which usually indicates that an existing upward trend will persist once the pattern is completed.
AAPL HEADING INTO AUG 25'AAPL TOPPED @ 250-260 TO CLOSE OUT 24
BAD Q1
Consistent since then.
Consolidation happened @ key weekly support $194-198 range, solid move up after.
Long Apple currently.
They have the IPHONE 17 releasing in Sept with a few new colors and new back design as well as other affordable options to assist with consumer retention, entry and re entry into the apple hemisphere for consumers.
Earnings July 31st, currently expected to increase YOY for Q3.
I expect earnings to come in strong to assist with the move up to try and work back to retest ATH again.
Long back up to $247 range to close out 2025 for Apple. End of year Q3, Q4 is always their time to shine. Don't think we see a break of ATH in 2025 for Apple though. Retest, to come back down slightly again before major break.

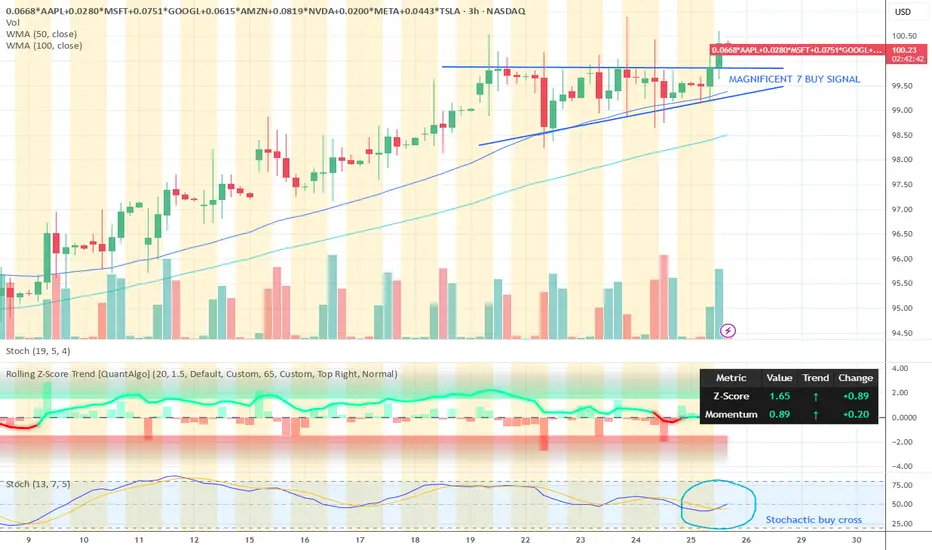
Magnificent 7 buy signalMagnificent 7 buy signal. These stocks are trading above their moving averages on 3 hour candle chart which is bullish. This basket made on tradingview consists of the 7 stocks.
Right now there is break through the resistance level and further upside is expected.
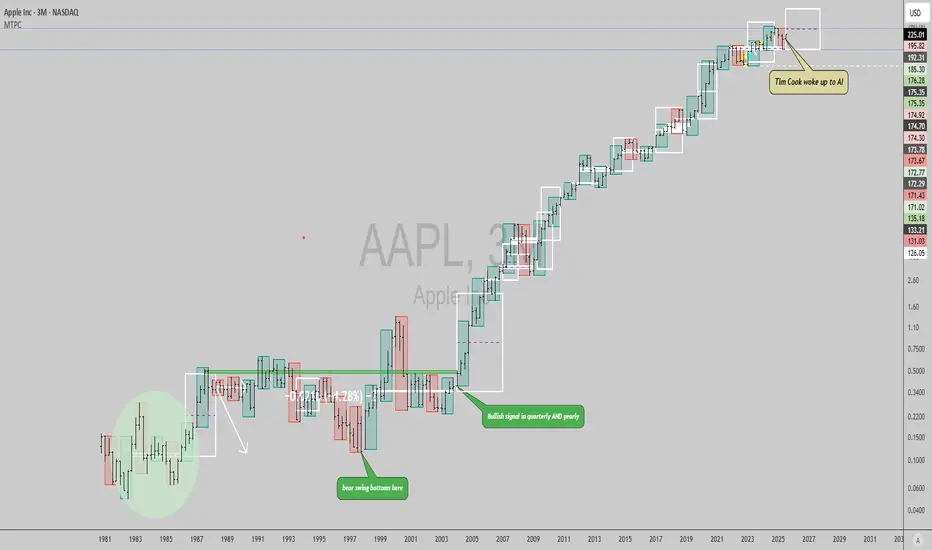
$AAPL: +57% in 2 years or lessLong term trend will confirm this quarter, nice catalyst with the events that took place a week ago after the latest earnings report: Tim Cook held a rare all hands meeting telling employees the following: The AI revolution is “as big or bigger” than the internet, smartphones, cloud computing and apps. “Apple must do this. Apple will do this. This is sort of ours to grab”.
Check out the historical track record of quarterly trend signals in the chart, every single damn one of them worked.
Best of luck!
Cheers,
Ivan Labrie.
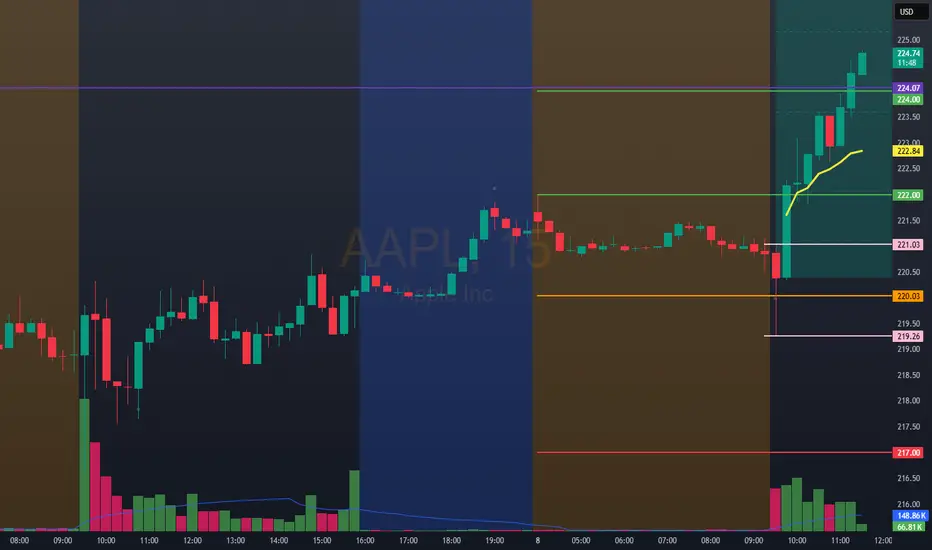
Trading AAPL 1:50 am 8/8/25Bullish Entry: 222.00 / 224.00 Bullish Stop 217.00 Bullish Target 226.00
Bearish Entry: 217.00 / 214.00 Bearish Stop 222.00 Bearish Target 208.00.....................Note that the 224.00 area is accompanied by a resistance
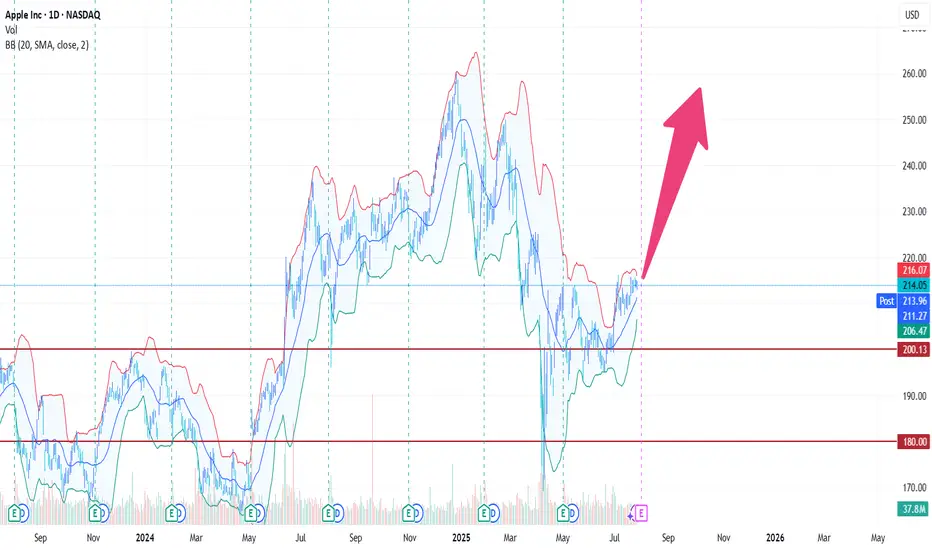
AAPL - Breakout in Apple After ConsolidationApple's stock appears to be breaking out of its three months trading range between 216 and 190, potentially opening the way for more upside from here. Not only did the pair break above the previous highs, it has also broken above the VWAP line from last year's highs.
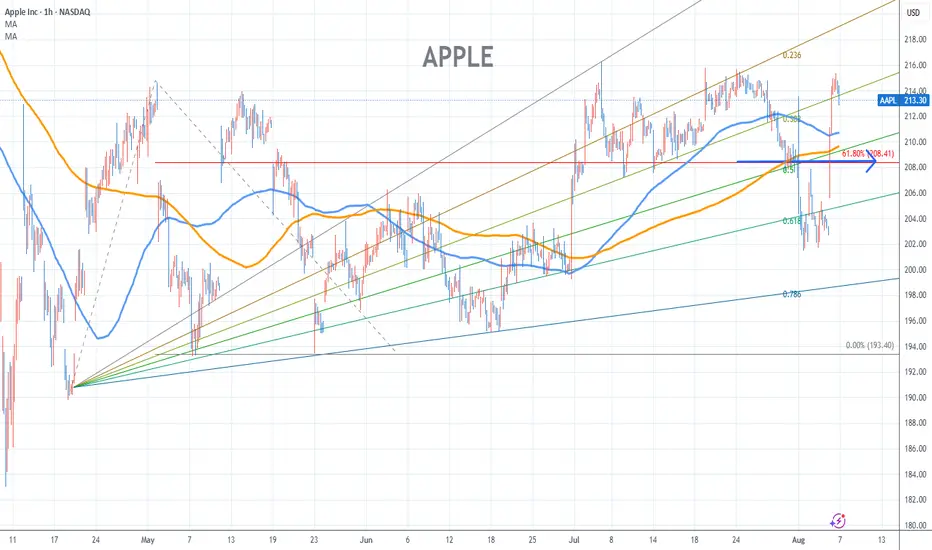
Apple Stock Chart Fibonacci Analysis 080625Trading Idea
1) Find a FIBO slingshot
2) Check FIBO 61.80% level
3) Entry Point > 208/61.80%
Chart time frame:B
A) 15 min(1W-3M)
B) 1 hr(3M-6M)
C) 4 hr(6M-1year)
D) 1 day(1-3years)
Stock progress:A
A) Keep rising over 61.80% resistance
B) 61.80% resistance
C) 61.80% support
D) Hit the bottom
E) Hit the top
Stocks rise as they rise from support and fall from resistance. Our goal is to find a low support point and enter. It can be referred to as buying at the pullback point. The pullback point can be found with a Fibonacci extension of 61.80%. This is a step to find entry level. 1) Find a triangle (Fibonacci Speed Fan Line) that connects the high (resistance) and low (support) points of the stock in progress, where it is continuously expressed as a Slingshot, 2) and create a Fibonacci extension level for the first rising wave from the start point of slingshot pattern.
When the current price goes over 61.80% level , that can be a good entry point, especially if the SMA 100 and 200 curves are gathered together at 61.80%, it is a very good entry point.
As a great help, tradingview provides these Fibonacci speed fan lines and extension levels with ease. So if you use the Fibonacci fan line, the extension level, and the SMA 100/200 curve well, you can find an entry point for the stock market. At least you have to enter at this low point to avoid trading failure, and if you are skilled at entering this low point, with fibonacci6180 technique, your reading skill to chart will be greatly improved.
If you want to do day trading, please set the time frame to 5 minutes or 15 minutes, and you will see many of the low point of rising stocks.
If want to prefer long term range trading, you can set the time frame to 1 hr or 1 day.
Apple Chart Fibonacci Analysis 080425Trading Idea
1) Find a FIBO slingshot
2) Check FIBO 61.80% level
3) Entry Point 203/61.80%
Chart time frame:B
A) 15 min(1W-3M)
B) 1 hr(3M-6M)
C) 4 hr(6M-1year)
D) 1 day(1-3years)
Stock progress:C
A) Keep rising over 61.80% resistance
B) 61.80% resistance
C) 61.80% support
D) Hit the bottom
E) Hit the top
Stocks rise as they rise from support and fall from resistance. Our goal is to find a low support point and enter. It can be referred to as buying at the pullback point. The pullback point can be found with a Fibonacci extension of 61.80%. This is a step to find entry level. 1) Find a triangle (Fibonacci Speed Fan Line) that connects the high (resistance) and low (support) points of the stock in progress, where it is continuously expressed as a Slingshot, 2) and create a Fibonacci extension level for the first rising wave from the start point of slingshot pattern.
When the current price goes over 61.80% level , that can be a good entry point, especially if the SMA 100 and 200 curves are gathered together at 61.80%, it is a very good entry point.
As a great help, tradingview provides these Fibonacci speed fan lines and extension levels with ease. So if you use the Fibonacci fan line, the extension level, and the SMA 100/200 curve well, you can find an entry point for the stock market. At least you have to enter at this low point to avoid trading failure, and if you are skilled at entering this low point, with fibonacci6180 technique, your reading skill to chart will be greatly improved.
If you want to do day trading, please set the time frame to 5 minutes or 15 minutes, and you will see many of the low point of rising stocks.
If want to prefer long term range trading, you can set the time frame to 1 hr or 1 day.

AAPL ShortBroader Market Structure (AAPL 1H):
The overall market structure on this 1-hour chart has shifted from a consolidation phase into a clear bearish trend. A Change of Character (CHoCH) occurred at $224.88, marking the breakdown of a key higher low and signaling the end of the previous bullish phase. This was followed by a Break of Structure (BOS) at lower levels, confirming bearish continuation. The structure now favors lower highs and lower lows, indicating a bearish directional bias.
Supply and Demand Analysis:
The supply zone near $224–228 is strong, as price dropped sharply from this area after a brief consolidation, showing aggressive selling and validating it as a significant resistance. Buyers previously stepped in around $194–196, creating a well-respected demand zone; price rallied with conviction from this level in the past, making it a strong base where buyers are likely to be active again.
Price Action Within Marked Region:
Price recently exited the upper consolidation range and is now moving impulsively lower toward the marked demand zone around $194–196. The rejection from supply was swift, and candles within the marked area show sustained bearish momentum with minimal bullish interruption. There is a clear lack of buying interest mid-structure, implying that price may continue descending into the demand zone.
Current Trade Bias & Outlook:
The bias remains bearish, with price likely to test the $194–196 demand area. Expect a potential short-term bounce once that zone is tagged. However, if buyers fail to hold this level, further downside toward $172–174 becomes plausible. An invalidation of this bearish outlook would occur if price reclaims and holds above $208, breaking the recent lower high.
Momentum & Candlestick Behavior:
Momentum favors sellers—price is printing strong bearish candles with minimal wicks, indicating conviction. No significant reversal patterns (like bullish engulfing or hammer candles) are visible yet, which supports continuation lower in the short term.

Apple Short Trade ideaAfter the positive earning brought enough buyside liquidity to be taken i have executed this short trade idea on Friday with almost 3 RR #Apple #short #smc #smartmoney #liquidity #trader #ict #liquiditygrab

Apple Stock looking bearishThe positive earnings brought enough buyside liquidity to be taken by the short sellers and im having this almost 3 RR trade idea that I executed on Friday

Apple repeating pattern to ATHA pattern I've used multiple times with Apple, looks like the same setup as April 2024 earnings.
AAPL - A potential earnings rallyDoes not mean it has to straight up jump after earnings it also can shortly go into the opposite direction but the main direction is up for the moment
End of correction or a drop?In the long-term trend of Apple stock, we all know it's clearly bullish. However, it has been going through a correction for a while now, and signs are starting to suggest that the correction may be ending. Once a trigger is confirmed, we can consider trading this stock and going for a buy.
APPLE: Weak Market & Bearish Continuation
Looking at the chart of APPLE right now we are seeing some interesting price action on the lower timeframes. Thus a local move down seems to be quite likely.
Disclosure: I am part of Trade Nation's Influencer program and receive a monthly fee for using their TradingView charts in my analysis.
❤️ Please, support our work with like & comment! ❤️
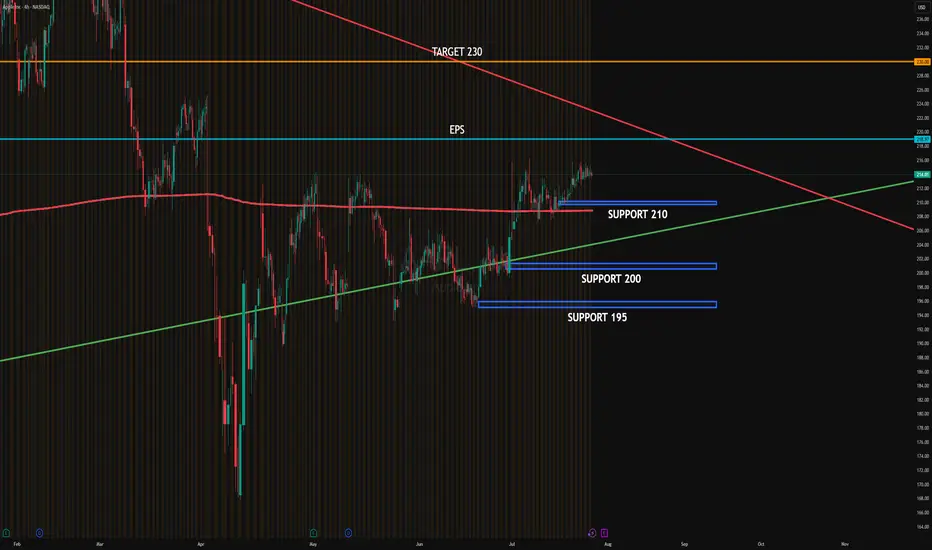
AAPL EARNINGSAAPL is consolidating just below the post-EPS resistance zone near 219, while institutions are actively defending support around 210. There's visible absorption at 210 and 205, aligning with high PUT interest, suggesting a strong institutional floor.
Distribution is evident in the 220–225 area, where CALLs are being sold to cap upside and benefit from theta decay.
Upside target: 230 if price breaks above 225 with volume.
Downside target: 200–195 if 210 fails to hold.
#AAPL #globaltrade #investment #investing #stockmarket #wealth #realestate #markets #economy #finance #money #forex #trading #price #business #currency #blockchain #crypto #cryptocurrency #airdrop #btc #ethereum #ico #altcoin #cryptonews #Bitcoin #ipo