$AAPL In ConsolidationNASDAQ:AAPL is consolidating here in a wedging pattern. I do not know which way this will resolve. But, since I rarely if ever short, I am looking on the long side of a trade. The thing I like about a consolidation pattern like this is, you know when you are wrong very quickly. My plan is to take a ¼ size long position if / when it moves above the 50 DMA (red) with a stop just below the most recent low (which would also correspond to dropping below the lower wedging trendline.
Then if it can break out over the upper downtrend line, I will look to build out my position. I thought this would be a good one to put on your watchlist. If you like the idea, please make it your own so that it fits within your trading plan.
AAPLB trade ideas

Breaking out!The price breaks through the purple resistance and is preparing to start an upward movement.
A compression triangle formation is taking shape, with the lows resting on the underlying purple trendline.
At $203.3, the weekly 100-period simple moving average (SMA100, green line) is located. A close above this level would be an important confirmation of the bullish reversal.

$AAPL Long Setup – Range Breakout Potential with Tight RiskApple ( NASDAQ:AAPL ) is finally showing signs of strength after a prolonged sideways range. Price is attempting to break above the Ichimoku Cloud on the daily chart while MACD is starting to curve upward—indicating a potential shift in momentum. After holding the $190–$200 zone as support for months, this move above $200 could trigger a short-term breakout toward the $220–$226 levels.
The current setup has a clean structure with a 4.27 risk/reward ratio:
Entry: $200.30
Stop: $195.07 (below recent range lows)
Target: $222.61 (prior high + pivot cluster)
If this move holds, it could mark the start of a trend reversal in Apple following months of chop. Solid setup for a 2–4 week swing trade or as part of a core position rebuild.
Let me know if you're playing this one or waiting for confirmation above $208.

AAPLApple shares trade in a consolidation zone after solid Q2 results—revenue at $95.4B (+5%), record services growth, and strong margins despite tariff headwinds.
Technically , indicators lean bullish, but resistance near $202–204 poses a short-term barrier. Market reaction to WWDC AI updates and further supply‑chain diversification will be key. On dips toward $196, there’s room for selective buying; if $204–214 breaks decisively, upside toward $235 could unfold . However, the lack of clear AI revenue guidance warrants caution, aligning with Needham’s cautious stance.

AAPL Bulls May Regain Momentum – Price Action Suggest a Bounce 🔍 GEX-Based Options Insight:
* GEX Cluster sits heavy at 204–206, marking a Gamma Wall / Resistance Zone.
* Highest NET GEX levels suggest 205–206 is a magnet if price builds strength.
* IVR: 16.2, IVX is low, indicating cheap premium for call buyers.
* Calls: 0.6% bias, showing a neutral-to-light bullish flow.
🟩 GEX Support: 197.5
🟥 PUT Walls: Below 192.5 and 190 (farther from current level)
🧠 Technical View (1H Chart):
* AAPL is pulling back into a demand zone while still respecting the upward channel.
* Just formed a CHoCH, signaling a potential reversal back up.
* Price is sitting on channel support + demand, with a recent BOS confirming bullish structure intact.
* Volume during this pullback is lower than the prior bullish leg—healthy retrace.
🔁 Trading Idea (for calls):
Entry:
🟢 Around 198.5–199 (channel and OB support zone)
Target 1:
📈 201.50 – retest of supply / GEX resistance
Target 2:
📈 204.88–206 – Gamma Wall target
Stop Loss:
🔴 Below 196.50, breaks OB and structure
🎯 Ideal Option Play:
* July 5th or July 12th 202 Calls
* Low IV makes this a decent R/R for directional play
* Momentum confirmation on reclaim of 200.80 gives confidence
💬 If AAPL can defend the current structure and flip 200.80 intraday, we may see a gamma chase back to 204+.
This analysis is for educational purposes only and not financial advice. Always trade with a plan and proper risk management.

Time to buy? Too much negative press. Buy in Fear- Updated 23/6Apple has been dealing with significant negative press recently, leading to fear and critical perceptions among investors. This situation suggests a common investment principle: in times of fear, you should buy, and in times of greed, you should sell. Consequently, I have taken a considerable long position on Apple.
The flag pattern is almost complete, indicating that a price movement is imminent. I have set my stop loss at $196, with an anticipated profit from a positive breakout expected to exceed $223, representing potential gains of over 10%. There is also further upside potential to surpass $230.
Apple is a strong long-term hold, regardless of current market fluctuations. The company boasts a mature and extensive ecosystem, making it a brand I wouldn't bet against. If you already own Apple products, you likely understand how unlikely it is that you would switch to another brand.
Last Friday's green candle validated the flag pattern, indicating that a breakout is still needed. However, the flag pattern has now shifted to a more bearish formation, which could suggest seller exhaustion and strong support at these price levels. Achieving above 202 USD would be both a positive sign and an indication of strong buyer interest. The Iranian conflict may cause volatility, but my long position is still active, and the upcoming weeks could see a positive breakout >202. Although this flag pattern is typically bearish, I believe Apple is undervalued based on its future potential offerings and this could be a good entry price? As always not financial advice but let me know if you think Apple is going to <170 or >230.
My target sell price is now 271 USD.

AAPL Daily – Key Breakout Zone AheadWe're currently sitting at the lower boundary of a large descending channel on AAPL in the daily timeframe.
After completing what appears to be a 5-wave Elliott bearish structure, the price made a strong bullish rebound. Since then, it has been consolidating in a mid-range zone, forming an ascending triangle, which could signal a continuation of the recent bullish move.
At the current price level, we can identify two key bullish patterns:
An ascending wedge (or "púa")
An ascending triangle
Both patterns are developing around the 0.78 Fibonacci retracement level of the last major bearish impulse — a critical zone. A breakout above this level could imply structural damage to the previous downtrend and open the door to a potential long setup.
🎯 Target zone: 232.00 – 235.00
Keep an eye on volume and breakout confirmation.

Apple: Next Week’s Long Trade Opportunity with Upside PotentialCurrent Price: $213.55
Direction: LONG
Targets:
- T1 = $225
- T2 = $240
Stop Levels:
- S1 = $210
- S2 = $200
**Wisdom of Professional Traders:**
This analysis synthesizes insights from thousands of professional traders and market experts, leveraging collective intelligence to identify high-probability trade setups. The wisdom of crowds principle suggests that aggregated market perspectives from experienced professionals often outperform individual forecasts, reducing cognitive biases and highlighting consensus opportunities in Apple.
**Key Insights:**
Apple continues to lead the technology sector with sustained bullish momentum. Strong seasonal trends averaging 13.4% gains during July and August further underscore its upside potential. AI-driven product developments and its role in mega-cap leadership positions it for ongoing strength, though near-term overextension risks persist.
**Recent Performance:**
Apple gained 6% last week, spotlighting its dominance among mega-cap stocks as a leader of the broader tech rally. While the "Magnificent 7" stocks, including Nvidia and Tesla, showed mixed signals, Apple has preserved relative strength and upward momentum.
**Expert Analysis:**
Portfolio managers have expressed confidence in Apple as part of the "big three" tech stocks, favoring its innovation and operational strategies despite valuation concerns. The mixed sentiment, with mentions of potential put activity, suggests cautious optimism, but its breakout above $213 highlights stronger short-term opportunities.
**News Impact:**
Apple’s AI initiatives, such as outsourcing Siri's development, contribute positively to market sentiment. Additionally, anticipation of earnings season strength in late July adds weight to bullish strategies. As mega-cap stocks maintain leadership, Apple’s pivot into AI-driven innovation reinforces its critical role in technological advancement.
**Trading Recommendation:**
Based on robust performance trends, seasonal advantages, and a supportive macro backdrop, a LONG position on Apple offers strong upside potential with defined risk parameters.

AAAPL: Updated Outlook and Best Level to BUY/HOLD 70% gains________________________________________
Apple Outlook: July 2025–Q1 2026
After peaking near $200 in late May, Apple (AAPL) remains under correction territory despite pockets of resilience, closing July around $193. The current correction is projected to persist until Q1 2026, as global macro and policy headwinds weigh on the broader tech sector. Technicals suggest AAPL could find its cycle low between Q3 and Q4 2025, potentially setting the stage for a renewed bull run into late 2026. Pullback until 170/175 USD. 📉
Catalysts Shaping Apple’s Stock Price in 2025–26
1. AI Integration and Apple Intelligence
Strength: 9/10
The roll-out of on-device Apple Intelligence features—including an upgraded Siri, ChatGPT integrations, and generative AI tools—continues to build anticipation for a major iPhone upgrade supercycle. Initial adoption has been strong, but broader impact will hinge on Q4 developer and enterprise feedback. 🤖
2. Services Segment Growth
Strength: 8.5/10
Apple’s Services business (App Store, iCloud, Apple Music, AI-powered subscriptions) is projected to post double-digit growth into Q4 2025, with consensus revenue estimates at $25–27B for the quarter. Analysts see upside from new AI-driven service bundles, which could add $5–8B in annualized revenue by 2026. 💡
3. Gross Margin Expansion & Cost Efficiencies
Strength: 8/10
Apple’s gross margin is forecast to improve by up to 60 basis points in Q4 2025 as the product mix tilts toward higher-margin services, and as component costs ease. Operational efficiencies from supply-chain automation may further cushion profit margins amid macro uncertainty. 📊
4. iPhone 17 Product Cycle
Strength: 7.5/10
The iPhone 17 lineup—rumored to include advanced polymer batteries and potential foldable form factors—is expected to launch Q4 2025, giving Apple a competitive hardware edge versus Android rivals. Early channel checks point to pent-up demand, though upgrade rates may lag previous cycles due to consumer caution. 📱
5. Vision Pro & Hardware Diversification
Strength: 7/10
Next-gen Vision Pro headsets and new AR/VR devices, boosted by Apple Intelligence, are expected to drive incremental growth in Q4 2025. However, high price points and limited mainstream adoption keep near-term impact contained. 🥽
6. Share Buybacks & Dividend Policy
Strength: 7/10
Apple’s $110B share buyback authorization and steady dividend growth provide valuation support, but recent market volatility has prompted a more cautious pace of repurchases. Yield-seeking investors are watching closely for any pivot in capital return policy if macro pressures persist. 💵
7. Supply Chain & Trade Policy Risks
Strength: 6.5/10
Escalating U.S.–China trade tensions—including the risk of expanded tariffs or tech export bans—remain a top concern. Apple is accelerating its assembly shift toward India and Vietnam to diversify risk, but any new policy shocks in Q4 could hit margins and unit volumes. 🌏
8. Regulatory & Antitrust Pressures
Strength: 6/10
The EU’s Digital Markets Act and potential U.S. antitrust probes could force Apple to further open up its iOS ecosystem by year-end, potentially capping Services revenue growth and adding compliance costs. ⚖️
9. Macro & Interest-Rate Environment
Strength: 5/10
With the Fed signaling “higher for longer” rates through mid-2026, tech sector valuations remain under pressure. Analysts see this limiting multiple expansion even if EPS growth resumes in late 2025. 📈
10. Smartphone Market Competition
Strength: 5/10
Aggressive pricing and innovation from Samsung and Chinese OEMs are intensifying competitive pressures, especially in emerging markets. Apple’s share gains are likely to slow until the macro environment improves and new hardware cycles fully materialize. 🥊
________________________________________
Analyst Projections for Q4 2025:
• Consensus Revenue: $108–112B (up ~4% YoY)
• EPS Estimate: $2.30–$2.42
• Gross Margin: 45–46%
• iPhone Unit Growth: 2–3%
• Services Revenue: $25–27B
Morgan Stanley and JP Morgan maintain “Overweight” ratings, but expect rangebound performance until macro and trade uncertainty clears. Most price targets for Q4 2025 hover between $195–$215, with upside potential post-correction into 2026. 📊
________________________________________
Analyst / Firm Date Rating Price Target (USD)
Barclays 06/24/2025 – 173 ()
Jefferies (E. Lee) 07/01/2025 Hold (Upgraded) 188.32
UBS (D. Vogt) 07/03/2025 – 210.00
J.P. Morgan (S. Chatterjee) 06/26/2025 Overweight 230.00
Morgan Stanley (E. Woodring) 03/12/2025 Overweight 252.00
Evercore ISI 01/31/2025 – 260.00
Redburn Partners 01/31/2025 – 230.00
D.A. Davidson (G. Luria) 05/02/2025 – 250.00
TradingView Consensus (avg) – Consensus 228.98
TipRanks Consensus (avg over 3mo) – Consensus 226.36

Time to buy? Too much negative press. Buy in Fear- Updated 7/7Apple has faced prolonged downward pressure from bearish investors. Despite its best efforts and some dips, the stock has steadily maintained a baseline price of 200 USD. The flag pattern required some adjustments along its path to break out, primarily due to geopolitical issues and economic variables. Ultimately, Apple broke out to the upside in the week of June 30th, as predicted in my earlier posts. This breakout resulted from end-of-Q2/H1 sell pressure, delivering a 7.56% gain or 15 USD. This is a very bullish sign for Apple, and with the tailwinds forming for September product releases, we can expect further gains as traders return and volume increases.
If Apple follows its historical profit trajectory (see pink line), we could see a new all-time high (ATH) in the region of 270 USD in September. The green resistance and support levels are highlighted, and I may use these to adjust my position, considering whether to short or go long once confirmation is established on the daily timeframe.
Apple has significantly underperformed compared to the other Magnificent 7 stocks, but I don’t believe it’s a company you should bet against in the current climate. With a slow rollout of AI and recent statements from Apple, they may not always be first to market, but they generally execute well. The remarks regarding Sony, Samsung, and Netflix by Apple were very revealing and demonstrate a solid long-term strategy. However, there may be some bumps along the way as they work toward their goals, potentially involving acquisitions.
The fear spread in the media is similar to the FUD (fear, uncertainty, doubt) often associated with Bitcoin, and this is typically a good time to buy. Remember the saying: if retail investors miss the boat, it’s gone, but if institutions miss it, they often bring the boat back.
While this is not financial advice, based on the green weekly candle, it's hard not to pay attention, and Apple may now have a very positive year ahead! Especially with the weakening dollar and reports stating that this will benefit them greatly.
My large long position is still intact, and my target price will depend on how we manage supports and resistances. I am looking to take profits at over 260 USD.

AAPL - Weekly HV/IV PerspectiveGood evening —
I wanted to do one more write up with that being on NASDAQ:AAPL as we enter the week with futures just opening.
HV10 (16.58%) is trending -11.56% below IV (28.14%) showing a weekly price gap differential of -$2.89 on the stated implied move to what trending markets are doing. This current IV value entering the week sits 69% within the sliding year spectrum.
Now, with Apple consolidating in range for almost eight weeks after selling off when it reached its 4T milestone in December of 2024, has now begun advancing back upwards in price. The strength here is obvious and the quality of company is well, Apple.
My price targets on the week is first the upper band of stated IV ($220.58) then moving on towards the upper implied range of HV63 ($225.87). I believe the markets are going to push apple higher while balancing the indices out selling off in other areas. This would start to accelerate HV10, as it is now 91.23% coiled to its yearly lows and needs to unwind. Hopefully with a few short-term trending days increasing we find our regression.
Please come back next week and see how our position and volatility progressed forward.

Apple's (AAPL) 2009 Long-Term Trendline BounceTechnicals:
After a daily a-b-c to long-term horizontal trendline support, when we zoom out, we can see Apple's 2009 Long-Term Trendline Bounce.
Monthly Chart:

$AAPL On The Run? NASDAQ:AAPL breaking out of the stage 1 and entering a stage 2 breakout back to prior support and resistance zones.
RSI is a little hot at 67.52 so it may trade sideways to allow a cooling off phase before grinding higher to reach its value. News is that it is investing in the USA.
Stop loss would be a trailing stop loss of $4.48.

AAPL LONG 05/07/2025Price has been moving inside a multi-year bullish tunnel, price has also broken a minor resistance level of 207$ with a nice bullish engulfing candle with some increase in volume on the last few daily candles.
Analysis HTF - Weekly
execution LTF - Weekly
Candle pattern - Bullish engulfing
Acceleration - Check
Volume - Check
Structure - Check
Moving average - X
Base rate - 70%(to hit stop loss)/30% to succeed
With the acceleration, volume pattern and strong multi year structure I suggest a base rate of 55%/45%(to succeed)
Good luck

Watch OutIf it breaks the 214 supply zone the next one to break is the 224 zone. I know most people would put stop loss around 193. However, that's where my smart money friend places his huge buy orders. He calls it the demand zone. Not financial advice.

AAPL // I used Fibonacci numbers. 144 is our ema support point. Let's look for closings above the green line for the trend.

aapl just got great news, great stock! ATH coming?? YEA???aapl just got great news, great stock!
bullish. so very bullish
let us know!
free transparent no edit no delete
🐉We value full transparency. All wins and fails fully publicized, zero edit, zero delete, zero fakes.🐉
🐉Check out our socials for some nice insights.🐉
information created and published doesn't constitute investment advice!
NOT financial advice

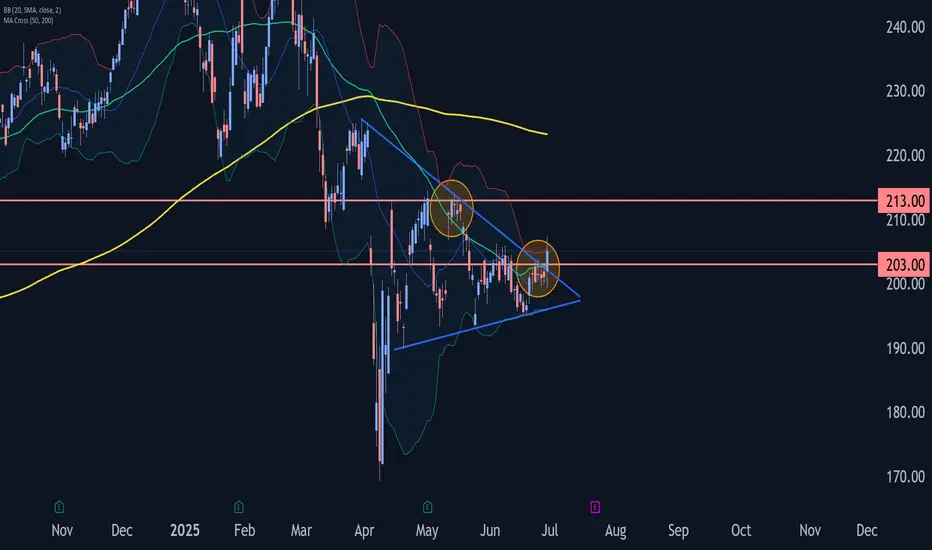
Apple Wave Analysis – 30 June 2025
- Apple broke resistance zone
- Likely to rise to resistance level 213.40
Apple recently broke the resistance zone between the resistance level 203.00 (which has been reversing the price from the start of June) and the resistance trendline of the daily Triangle from March.
The breakout of this resistance zone should add to the bullish pressure on Apple.
Apple can be expected to rise to the next resistance level 213.40, which reversed the previous waves (A), (C) and (2), as can be seen below.
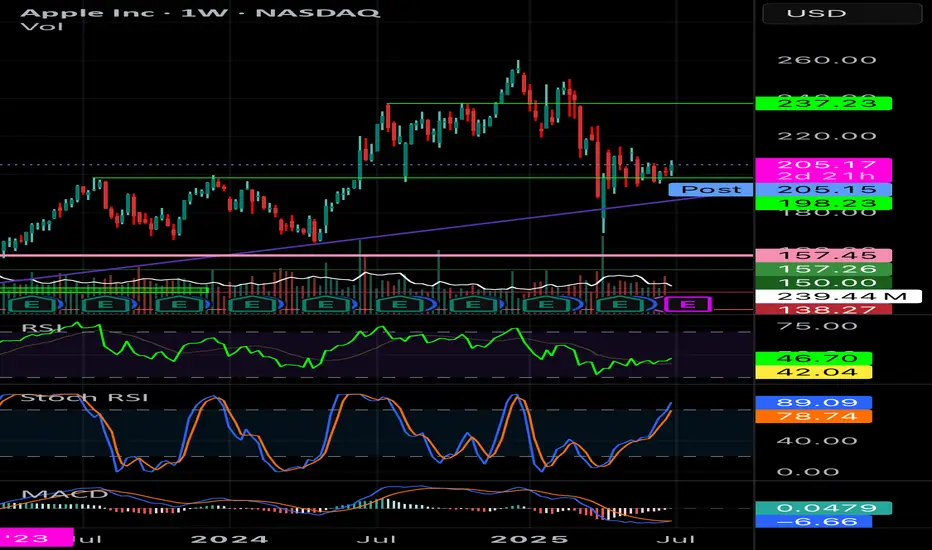
AAPL Weekly ChartOn the weekly chart, AAPL seems to find support on a previous resistance level after testing it several times. Macd has signaled a green as well. Seems optimistic.
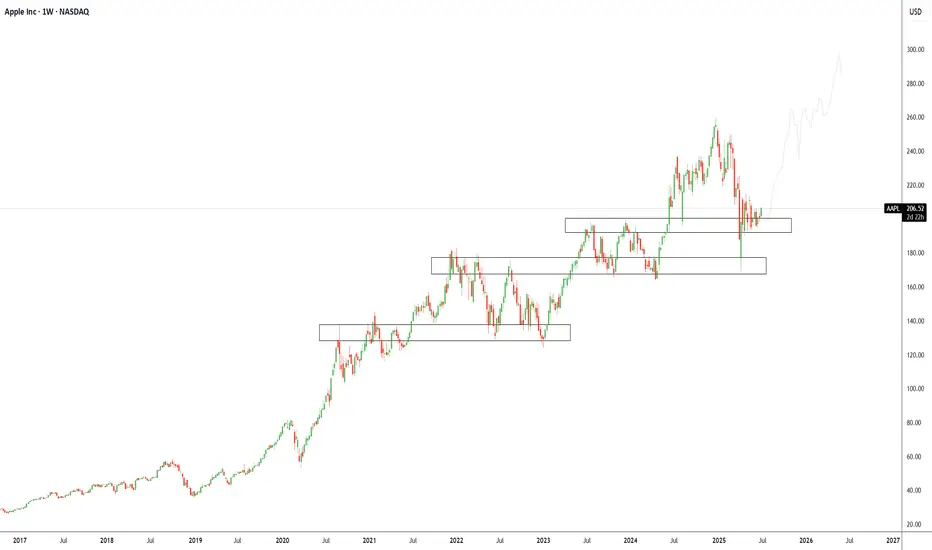
Apple Inc (APPL): Trend Continuation to $300+Overview Summary
We’ve added new long positions on Apple ( NASDAQ:AAPL ) recently after a textbook rejection from a well-established support/demand zone between $185–$200. This area has consistently acted as a launchpad for previous rallies and is now once again serving as a structural support on the weekly timeframe.
Apple’s ability to consistently innovate through product cycles, expand its services ecosystem, and integrate AI-driven features into its devices provides strong conviction for long-term upside. With Vision Pro, Apple Intelligence, and chip-level innovations underway, the company is positioning itself to benefit from both hardware and software expansion over the next decade.
Technically, the price has formed a multi-year stair-step structure with clear levels of accumulation. We believe NASDAQ:AAPL is beginning its next leg higher after consolidating above this zone. A clean move to retest all-time highs is likely, and a long-term target of $300 aligns with both trend structure and growth potential.
Green Zone Capital remains bullish on NASDAQ:AAPL with a long-term horizon and will continue to scale into strategic pullbacks within the broader uptrend, our current setup is:
Bias: Long
Type: Long-Term Accumulation
Entry Zone: $190–$205
Target: $300+
Invalidation: $165
Technical Analysis:
Apple is currently sitting at a critical demand zone that has historically acted as a base for previous multi-month rallies. Our TradingView chart highlights several key structural zones showing Apple’s tendency to build stair-step accumulation ranges followed by breakouts. The current zone between $185–$205 has been tested and held multiple times, confirming its significance.
We are seeing bullish rejection candles forming on the weekly timeframe, showing buyer interest is returning. This confluence of technical support and long-term structural demand confirms our long entry thesis.
Macro/Fundamental Thesis:
Apple remains one of the strongest tech companies globally with unmatched brand equity, pricing power, and integration across hardware, software, and services. The company continues to expand aggressively into AI with Apple Intelligence, spatial computing with Vision Pro, and strategic chip development.
With record cash reserves, a loyal consumer base, and continued innovation cycles across iPhone, Mac, and Services, Apple remains a strong defensive and offensive tech allocation in any long-term portfolio. Despite current macro volatility, Apple has consistently outperformed over market cycles.
AAPL : Technical Analysis Report - 29 June 2025
Trend:
The primary trend (big picture) is downward. Bearish momentum is weak.
Short Term Trend : sideways / consolidation. Momentum in sideways trends is usually weak and indecisive. Sideways within a long term downtrend is often a continuation pattern.
Reasons:
Market Uncertainty: Waiting for news, earnings, or macro events.
Accumulation/Distribution: Smart money prepares for the next move (either continuation or reversal).
Pattern : Symmetrical Triangle Pattern
The pattern represents a temporary pause in the prevailing trend. The symmetrical triangle is considered a continuation pattern. This means that the price is likely to continue in the direction of the trend that preceded the triangle's formation. Neutral pattern until the breakout direction is confirmed.
Key levels :
R2 - 214
R1 - 206
S1 - 193
S2 - 186
Tips for Trading
Wait for a confirmed breakout (e.g., a daily candlestick close above/below the trendline) to avoid false signals
-----------------------
Note :
If you’re interested in receiving detailed technical analysis reports on your selected stocks, feel free to reach out to me. I can provide you with customized reports covering trends, key levels, momentum, patterns, and price projections to support your investment decisions.

AAPL: Premium PlayApple beat expectations this quarter—revenue, profit, EPS—all slightly better than analysts hoped. But the stock dropped to $196.26, down from $212.83. Why? Investors are still worried about tariffs, margin pressure, and supply chain changes.
Tim Cook talked about strong product sales (iPhone, Mac, iPad) and all-time high Services revenue. But he also admitted tariffs and regulatory issues are weighing on Apple’s outlook.
My Covered Call Strategy
I’m selling the $202.5 call and buying the $210 call for June 27, 2025. Big money seems to be doing the same—there was a huge premium sale over $2 million, likely betting Apple stays range-bound short term.
- Why this works:
- Resistance near $202.50 gives me a clear ceiling
- Apple fundamentals are strong, but macro risk caps upside
Chart Notes
- Resistance: $202.50 and $210
- Support: Around $192.50
Bottom line:
I like this trade as a way to bring in income while defining my risk. If Apple grinds sideways or pushes a bit higher, the trade still pays. Clean structure, high odds.

(Daytring) APPL quickly trade1. Premarket created a support line
2. Sma 200,50 is here
3. Price goes up in the moring just pull back to retest.
=> entry. Take profit whenever i feel good
