$AAPL Cup n Handle Breakout (Room to $255ish)Cup n Handle Breakout is confirmed well above neckline, if handle length is = to breakout length wizardman* is at right level (timing TBD, but Santa is supposed to be around then...)
- Prophecies
AAPLB trade ideas

Apple Stock at $300When a stock is expected to reach new all-time highs, there’s often no clear technical level to mark those targets on the chart, my dear traders. However, from a broader perspective, Apple (AAPL) continues to demonstrate strong growth potential.
In my view, there’s no fundamental reason to believe the stock will not keep climbing. Apple remains a solid choice for long-term investors, backed by its consistent innovation, strong financials, and dominant position in the market.
While short-term fluctuations are always possible, the long-term trend for Apple seems intact. For now, the outlook remains bullish as the company continues to deliver value and maintain its leadership.
What are your thoughts? Let’s discuss!

BUY APPLEApple is an uptrend channel and bullish on the weekly timeframe.
The next target is to the upper of the channel at area 265-270.

AAPL: Key Levels & Strategies for Big ProfitsNASDAQ:AAPL AlexGoldHunter Analysis Using Price Action Techniques
Key Levels and Zones
Support and Resistance Levels:
Support: Around $242.98 (Swing Low p/D Low) and $244.00.
Resistance: Around $248.12 (current price) and $250.00 (Swing High p/D High).
Volume Profile:
High volume nodes around $244.00 and $248.00 indicate significant trading activity and potential support/resistance zones.
Order Blocks (OB):
Identified near $230.00 and $244.00, suggesting areas where institutional buying or selling might have occurred.
Price Action Patterns
Break of Structure (BOS):
Multiple BOS annotations indicate areas where the price has broken previous highs or lows, signaling potential trend continuation or reversal points.
Change of Character (CHoCH):
CHoCH annotations suggest shifts in market sentiment, potentially indicating reversals or significant pullbacks.
Indicators
RSI:
Current RSI value around 62.93 suggests the market is not overbought or oversold.
MACD:
The MACD line is above the signal line, indicating bullish momentum.
Buy Strategy
Entry Point:
Consider buying near the support level around $244.00, especially if there is a bullish candlestick pattern or a BOS above this level.
Stop Loss:
Place a stop loss below the recent swing low or the support level at $242.98.
Take Profit:
Target the resistance level around $250.00 or higher if the price shows strong bullish momentum.
Sell Strategy
Entry Point:
Consider selling near the resistance level around $250.00, especially if there is a bearish candlestick pattern or a CHoCH indicating a potential reversal.
Stop Loss:
Place a stop loss above the recent swing high or the resistance level at $250.00.
Take Profit:
Target the support level around $244.00 or lower if the price shows strong bearish momentum.
Conclusion
This chart provides a detailed view of AAPL's price action, highlighting key support and resistance levels, volume profile, and significant price action patterns. By using these price action techniques, traders can develop a buy and sell strategy based on the identified levels and patterns.
Happy trading! 📈📉
Follow @Alexgoldhunter for more strategic ideas and minds

AAPL on the Edge! Key Levels for Trading This Week Dec.16Daily Timeframe Analysis (Longer View)
1. Trend:
* AAPL is in a strong uptrend, respecting the rising wedge pattern and trading near resistance.
* Price is consolidating at $248–$250, a critical level for direction.
2. Key Levels:
* Resistance: $250.80 (recent high). Breaking above could trigger continuation toward $255.
* Support: $240 (previous consolidation zone) and $235 as a lower support.
3. Indicators:
* EMA 9/21: Price is above both EMAs, signaling continued bullish momentum.
* MACD: Flattening, showing weakening momentum, which could lead to a pullback.
* Volume: Relatively steady but not showing strong buying pressure.
Daily Outlook:
* If AAPL holds above $248, it can test $250.80–$255.
* Failure to hold could lead to a retest of $240 as support.
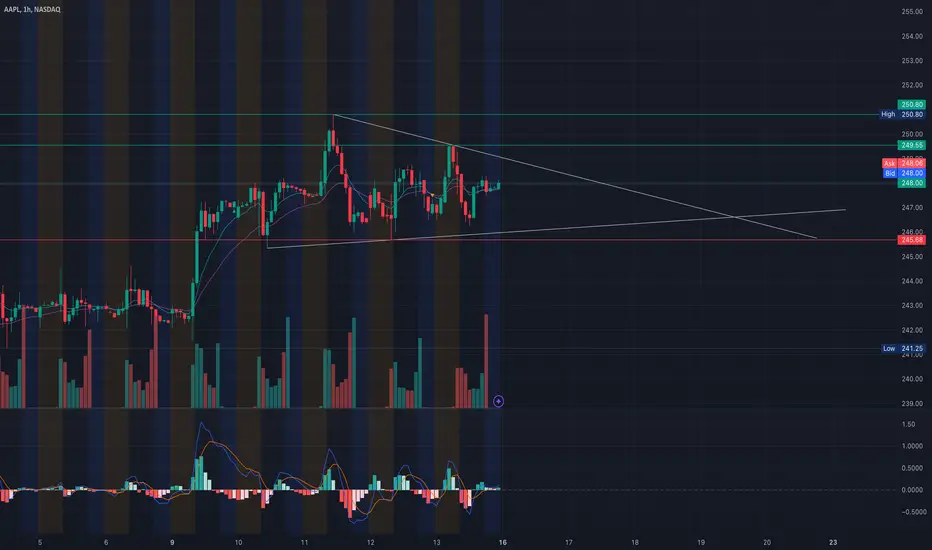
1-Hour Timeframe Analysis (Shorter View)
1. Trend:
* Price is consolidating in a descending triangle, with lower highs and stable support near $246.
* The short-term trend is neutral to slightly bearish, awaiting a breakout or breakdown.
2. Key Levels:
* Resistance: $250.80 (upper trendline).
* Support: $245.68 (lower trendline).
* If $245 breaks, the next level is $241.25 (recent low).
3. Indicators:
* MACD: Bullish crossover forming, suggesting a short-term upside move.
* Volume: Increased red volume shows bears are still active, but buyers are stepping in.
1-Hour Outlook:
* Watch for a breakout above $250 for bullish continuation.
* A breakdown below $245.68 could trigger further downside toward $242.
Direction and Strategy For Tomorrow (Scalping):
* Look for a breakout above $248–$250 to scalp toward $252–$255.
* Short if AAPL rejects resistance at $250 and breaks $246, targeting $243–$245.
For Next Week (Swing Trading):
* Bullish Setup: If AAPL breaks $250.80 with volume, it could rally to $255+.
* Bearish Setup: If it fails to hold $245, look for downside toward $240–$235.
Summary
* Short-term Bias: Neutral to slightly bullish; watch for a breakout or breakdown.
* Key Zones: $250 resistance and $245 support.
* Swing Direction: Needs confirmation above $250 for bullish continuation; failure risks pullback to $240.
-----------------------------
GEX Analysis For Option Trading
-----------------------------
Key Observations from GEX Levels:
1. CALL Walls (Resistance):
* 247.6: The highest positive GEX level, acting as key resistance. This is where upward momentum could slow down or reverse.
* 252.5–255: Additional strong resistance zones, aligning with the 2nd and 3rd CALL Walls.
2. PUT Walls (Support):
* 237.5: The strongest PUT wall and likely the first support level where price could stabilize.
* 225: The 2nd PUT wall—this acts as a deep downside support level.
3. Gamma Sentiment:
* Neutral to Bearish Bias: Gamma exposure shows a balance, with a slight tilt towards the downside due to the PUT wall activity.
* Elevated resistance at 247.6 suggests CALL buyers may cap price movement.
4. IVR and Options Oscillator:
* IVR: 11% indicates low implied volatility, making options relatively cheap for directional plays.
* CALL Positioning: At 17.1%, call positioning is weak, signaling limited bullish momentum.
Technical Analysis for Options Trading (Using GEX):
1. Bearish Option Trade Setup:
* Entry: Look for rejection at 247.6 (CALL wall resistance) or a failed breakout above 252.5.
* Target: First target near the 237.5 PUT support, with an extended target at 225.
* Option Strategy:
* Buy PUT options (near-the-money strikes) with 30–45 days to expiration to allow time for the trade to play out.
* Alternatively, use a Bear Put Spread (e.g., buy 245 PUT, sell 235 PUT) to reduce cost.
2. Bullish Option Trade Setup (Short-Term):
* Entry: If price consolidates above 247.6 with volume confirmation, look for a push toward 252.5.
* Target: CALL wall at 252.5, with stop-loss below 247.
* Option Strategy:
* Buy CALL options with short expiration (0DTE or 1-week out) to capitalize on quick moves.
* Use a Bull Call Spread (e.g., buy 247 CALL, sell 252 CALL) for a cost-effective approach.
Conclusion & Directional Bias:
* Bearish Outlook: Price is struggling near the 247.6 CALL wall, and low IVR suggests options are cheap for PUT strategies.
* Key Levels to Watch:
* Resistance: 247.6 and 252.5
* Support: 237.5 and 225
For options trading, focus on PUT options if rejection occurs at resistance or CALL spreads if bullish confirmation is seen above key levels. 🚀
Short Disclaimer:
This analysis is for educational purposes only and does not constitute financial advice. Always do your own research and manage your risk before trading.
15 minute timeframe for AppleHere is a 15 minute timeframe for Apple it shows boxes from November until now.

APPLE: Short Trade with Entry/SL/TP
APPLE
- Classic bearish formation
- Our team expects pullback
SUGGESTED TRADE:
Swing Trade
Short APPLE
Entry - 248.12
Sl - 253.76
Tp - 237.63
Our Risk - 1%
Start protection of your profits from lower levels
❤️ Please, support our work with like & comment! ❤️

APPLE Will Collapse! SELL!
My dear friends,
My technical analysis for APPLE is below:
The market is trading on 248.12 pivot level.
Bias - Bearish
Technical Indicators: Both Super Trend & Pivot HL indicate a highly probable Bearish continuation.
Target - 240.15
Recommended Stop Loss - 252.41
About Used Indicators:
A pivot point is a technical analysis indicator, or calculations, used to determine the overall trend of the market over different time frames.
———————————
WISH YOU ALL LUCK

AAPL ..Apple aka macintosh, is hitting a wallWell like I said in the last, here is another CyQo-Cpyder-Nest
Should say how I got these lines but you dont answer anything you werent asked, just a family code I lived by from my grandfather..a young boy to Czech immigrants in the Northeast. Also it was reiterated to me and 6 close buddies by John Bogle himself who was dining with us, one was his nephew, and said a lot...but one thing I'll share is write and explains my lst published post idea:
"They are all animals, you are to treat them as such. When you approach them you be kind like you are there for help and to naturally coexist using each other's strengths. But when you see them turn wild...you must contain them and give them the prison they want- a vacation resort to them- yet you see it as a prison. You know why its a prison boys? Cause they can't think for themselves...they actually dont want to. These refuse. They want someone..something..some, whatever comes up- those phones you boys have..and shouldnt get used to..those can be the next mind distractor. Never turn down free when you logically see it as a benefit. Did the guy who wants to sharpen his skills giving free shaves seem too good to be...of course- but you give him a try, cause a man with a stock trade or a thrifty CEO- like some of your dads- may say something to him. Ha.HA..Granted I'm saying this to you boys at a place like this that cost 45 grand for highschool, but one of you here I'm told was a prior animal...with hard working parents of no means..Ha, you said your dad pulled over a man and gave him a free pass. That free pass was number to call for you to get into here- what if your dad threw out the paper with a number....You wouldnt be at the fine table with Mr. Vanguard himself..Now where did he get off to. Thanks and pardons for leaving- a call awaits."
^^^I give fun levels and fun stories..from one of the greats himself...and you didnt do anything- I think its what you called the roaring 20s lol or 50s..helping and building lol
Toodle..until I get another Idea for Doodles you dont know what you dont ask...

AAPL ..Judge my CyQo-Cpyder-NestSo here is the long term views I never show of my Nest projects...
Judge what you want, but think its just making things fit....well they fit pretty well to be just made to fit....especially when you view my Tesla (TSLA) chart and see that price action...
Anywho...minus having to pay to see these, no..you dont and wont....I dont hide behind subscriptions or these crappy shows...
Ford showed the world a car, Rockerfeller- how to run an oil conglomerate...You benefit from both- But they never said you needed a course or subscription, you just benefited by living.
These charts will bring you money as with shorts or longs they bring me money...Why charge for food- Its cause you can get your own by hunting..you choose not to. But when someone hands you something for free that you must click the mouse button of buy or sell..its like the guy saying lift heavy things to gain muscle..only you are to blame if you dont do it.
Enjoy these levels and this brief inspirational message...Buffet told you the market future, you didnt have to sign up for anything to hear his cash position and unspoken short/put favoring....head up and you wont run into the wall, head down and your phone will tell you if there is or isnt one infront of you- your living experience vs another's perception.
Next post..hyper short, well 30 min, AAPL trade levels....See that rainbow-on-the-right...lots of goodies inside.

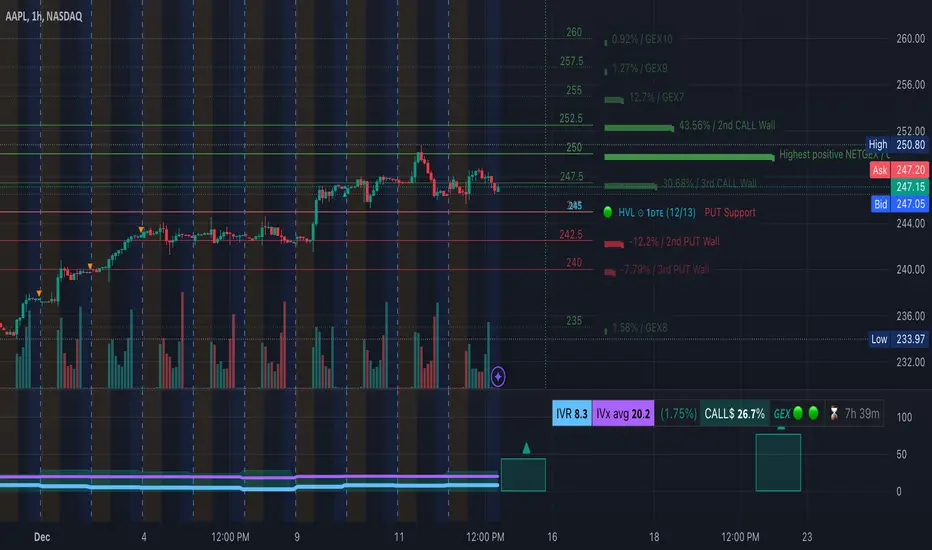
GEX Analysis for AAPL - December 13, 2024Current Price: $247.05
IVR: 8.3
IVx Average: 20.2
Options Sentiment: Moderately bullish with 26.7% in Calls.
Key Levels:
* HVL (High Volume Level): $245.00
* Support Levels:
* First Support: $245.00 (PUT Support)
* Second Support: $242.50 (2nd PUT Wall)
* Major Support: $240.00 (3rd PUT Wall)
* Resistance Levels:
* First Resistance: $247.50 (3rd CALL Wall)
* Second Resistance: $250.00 (2nd CALL Wall, Highest Positive NETGEX Level)
* Extended Resistance: $255.00 (GEX7 Level)
Market Sentiment:
* AAPL is hovering near a critical volume level at $245.00, showing mixed momentum. A breakout above $247.50 could lead to bullish continuation toward $250.00 or $255.00.
* Failure to hold above $245.00 may shift sentiment bearish, targeting $242.50 and possibly $240.00.
Actionable Strategy:
* Bullish Setup: Long positions above $247.50, targeting $250.00, with a stop loss at $246.50.
* Bearish Setup: Short positions below $245.00, targeting $242.50, with a stop loss at $246.00.
Reminder:
Always verify updated IVR and IVx metrics for live market conditions before entering trades. These provide critical real-time insights.
Disclaimer: This analysis is for educational purposes only. Please perform your own research before trading.
AAPL to back to 200 in a flatCan't help but see the moves since August as 2 corrections in a row for W-(A) and W-(B). This followed up with what looks like a leading diagonal for W-1 of W-(C). The subcount for W-2 had a=c and 61.8% both right at 230.5 which it bounced off today. Not pictured, I do have a potentially for 1 more small high before the drop. I'm also pretty bearish on GOOG, AMZN, and MSFT in the same timeframe so this would line up.

$AAPL Trade ideaNASDAQ:AAPL forming nice flag. Could break either side. Short term, I am bearish as it need to retest the zone around 244$. If this breaks above 248.73 this can fly to 250$ level again.

AAPL Winding up for a Pump or Massive Drop - Inflection PointWithin the next few quarters we're likely to see some impressive fireworks in the various markets around the world as we gear up for multiple black swan events IE negative oil prices.
The storm isn't over, it's just begun.
3 Month
Monthly
Weekly
Daily

Elliott Wave View: APPLE (AAPL) Continue Rally In Bullish SequenShort Term Elliott Wave view in APPLE (AAPL) suggests that rally from 8.05.2024 low is incomplete & should continue upside as the part of daily bullish sequence. It is showing 3 swing higher since August-2024 low & expect more upside against 11.04.2024 low. It ended (1) at $237.49 high as diagonal & (2) correction at $219.71 low. Within (1), it placed 1 at $232.92 high, 2 at $213.92 low, 3 at $233.09 high, 4 at $221.14 low & finally 5 ended at $237.49 high as (1). Within (2) correction, it placed A at $227.30 low, B at $234.73 high & C at $219.71 low near 0.382 Fibonacci retracement of (1). Above (2) low, it favors upside in (3) of ((1)) & can extend towards $261.29 or higher levels before major pullback may seen.
Above $219.71 low, it placed 1 of (3) at $230.16 high, 2 at $225.71 low & favors upside in 3 of (3). Within 3, it placed ((i)) at $235.65 high, ((ii)) at 233.26 low & ((iii)) at $250.80 high as extended wave. Short term, it favors upside in ((v)), if ended ((iv)) at $246.02 low, which already reached between 0.236 – 0.382 Fibonacci retracement area of ((iii)). It needs price separation to confirm the view of further upside. Alternatively, if it extends lower from current level, it can either extend ((iv)) or 4 pullback in (3) as discussed in video. But in either the case, it should extend higher to finish sequence started from 11.04.2024 low as (3). We like to buy the pullback in 3, 7 or 11 swings at extreme areas, when reached. It expects more upside towards $261.29 or higher levels, while dips remain above 11.04.2024 low.

Mag 7 Broadening WedgeThis is a clean ascending broadening wedge/megaphone for the mag 7. Currently trying to bounce at the bottom end with potential support below near 2,225. Important to watch moving forward this week, I would be cautious if it does break below 2,225. Bulls get the green light if holds the wedge/2,225.

Apple is starting to look good (again:)If you're bullish on the market and economy overall, Apple is firming right below the resistance area under its ATH set less than a month ago on October 21 closing at $236.48. That high was set despite a steady net distribution since July! As of last nights' close, Apple hasn’t given up much ground closing at $225. For sure big sellers are camped out around $236–$231, but the fact that buyers are still soaking up the supply is interesting. We're seeing buyers bid up the lows: August 5 at $196, September 18 at $217.5, and November 4 at $219.7.
Short term, the only question is: who are the sellers? Could be Berkshire Hathaway. Buffett’s been unloading Apple for months now, reportedly taking advantage of low tax rates—at least, that’s the line he’s putting out there. Yet, someone is absorbing all that supply for more than 4 months.
So, if you’re looking for a bullish setup, keep an eye on how buyers handle that $231–$236 resistance. Apple’s price behavior here is saying something, despite major distribution...
Full Disclosure: If there’s one stock I’ll never, ever short, it’s Apple. Why? Because, like it or not, the market can’t make a move without Apple leading the way. Apple isn’t just a stock—it’s the most important stock in the universe. Now that you know how biased I am, navigate with care!

AAPL SELL++++ $235 reversal comingOverbought here and I would add to a position short every $3 increase in price. We are overdue a correction first target is $235

Apple trading I deaWhat is your opinion in apple?according to my view the growth is still continuing to 250 _! 260 in the next few weeks however I will be expecting a corrections to come n test previous high then you can take some actions,note that trading is risky and you might loose all your money do trade accordingly and follow the rules and trend properly thank you.

APPLE targeting $265 at the top of the Channel UpApple (AAPL) has been trading within a Channel Up pattern since the January 03 2023 bottom. At the moment the price is on the pattern's second long-term Bullish Leg, supported by the 1D MA50 (blue trend-line).
As long as this line holds, we expect the Bullish Leg to complete a +20.82% rise (similar to December 14 2023) from the U.S. elections low and target $265.00. The fractals are quite similar as the 1W MACD is forming now a Bullish Cross, in indentical fashion as November 20 2023.
-------------------------------------------------------------------------------
** Please LIKE 👍, FOLLOW ✅, SHARE 🙌 and COMMENT ✍ if you enjoy this idea! Also share your ideas and charts in the comments section below! This is best way to keep it relevant, support us, keep the content here free and allow the idea to reach as many people as possible. **
-------------------------------------------------------------------------------
💸💸💸💸💸💸
👇 👇 👇 👇 👇 👇

AAPL Technical Analysis for December 10, 2024Price Action:
* Opening Movement: At market open, AAPL exhibited a strong upward momentum, driven by sustained buying pressure, pushing the price above key resistance levels.
* Mid-Day: Consolidation occurred around the $247.5 zone, aligning with significant GEX levels, indicating a potential pause for profit-taking and repositioning by traders.
* Closing Trend: The price continued testing the $247.5 level but failed to breach higher resistance zones near $250, showing sellers gaining control near critical gamma levels.
Key Indicators Observed:
1. GEX Indicator:
* $250 Level: Marked as the highest positive GEX, acting as a psychological resistance for traders, confirmed by price hesitation and lower volume near this zone.
* Support at $240: The GEX8 level at $240 served as a critical support level, ensuring downside protection and absorbing selling pressure during earlier intraday pullbacks.
2. Trend Lines:
* The upward sloping trendline provided structural support for the price, confirming the bullish sentiment for the day.
3. MACD:
* The MACD showed a bullish crossover earlier in the day, coinciding with the breakout above $245. However, the histogram started to flatten towards the close, signaling reduced momentum.
4. Volume:
* A noticeable volume spike during the break above $245, indicating strong participation. However, the fading volume near $250 suggests waning bullish momentum.
GEX Indicator Insights:
The Gamma Exposure (GEX) tool proved invaluable in identifying critical support and resistance zones:
* Why it Matters: GEX quantifies gamma levels based on options market activity, offering a transparent view of zones where market makers are likely to hedge, influencing price behavior.
* What Was Observed:
* The resistance at $250 aligns with high positive gamma, making it challenging for the price to push higher unless significant buying pressure emerges.
* The bounce from $240 confirms GEX8 as a robust support level, providing confidence to traders to go long at dips.
* Technical Advantage: By incorporating GEX, traders can anticipate areas of increased volatility or stagnation, enhancing decision-making precision.
Trading Plan for Tomorrow:
Scalping Strategy:
1. Entry Points:
* Long Above $247.5: Look for a breakout with strong volume confirmation.
* Short Below $245: If the price fails to hold and breaks below $245, target the $240 support level.
2. Stop-Loss: Set tight stops at $1 above or below entry points to manage risk.
Swing Trading:
1. Bullish Scenario:
* If AAPL closes above $247.5 with volume, target $250 with an extended swing goal near $255.
2. Bearish Scenario:
* A close below $245 opens room for a pullback to $240. A further breakdown could test $235.
Disclaimer:
This analysis is for informational purposes only and should not be construed as financial advice. Always perform your due diligence before making any trading decisions

AAPL P/E at $40???One shouldn't need to have an analysis when NASDAQ:AAPL is trading at > 40x P/E. I went back and counted, there are only 4 days in the history of AAPL where it traded above the current multiple and all 4 of those days came in the post-covid-free-money-boon when they last had actual growth.
Now, a company with a year average revenue growth rate of 5% is trading at 40x+?? For comparison, NASDAQ:NVDA is currently trading at ~55x P/E.
AAPL is chasing 4T. There is nothing fundamental about this price except for the "apple always goes up" narrative. From a fundamental perspective, putting money in at this price to go long is absurd.
The only _potential_ positive that Apple has right now is that Tim has cozied up to Trump and may be able to sway him to apply tariffs to his competition in a way that is more damaging to them (Samsung) than they are to Apple (if they are damaging at all). But even at this price that potential just doesn't hold the risk reward for a 1-3 year play to allow that to come to fruition. It seems more likely to me that any form of tariffs (if any) that may benefit Apple will be a local maximum as the larger tariff strategy will likely hurt the economy, more than offsetting any value that Apple gets as a leg up over its competition.
Anywho, Apple is now trading right at the top of an 8 month range is is flashing overbought across the board. There is more downside from here in the short to medium term than upside.

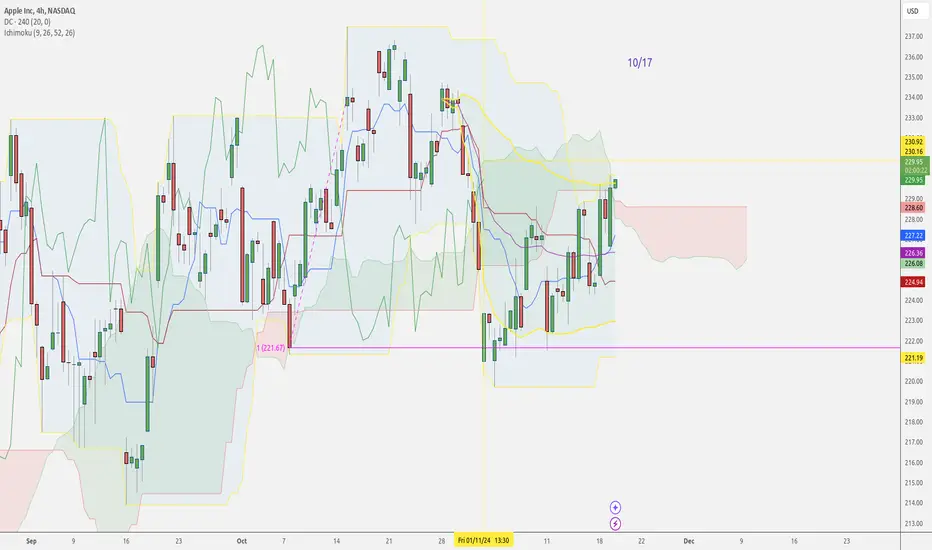
New Temporary HighWe are rising in the short term at least. Now we have exceeded the cloud.
After the downward correction of the rise from beginning of November we got a new high 5 hours ago. So we can assume that we may rise further.