AAAPL: Updated Outlook and Best Level to BUY/HOLD 70% gains________________________________________
Apple Outlook: July 2025–Q1 2026
After peaking near $200 in late May, Apple (AAPL) remains under correction territory despite pockets of resilience, closing July around $193. The current correction is projected to persist until Q1 2026, as global macro and
Key facts today
0.30 USD
75.08 B USD
313.21 B USD
About Apple Inc
Sector
Industry
CEO
Timothy Donald Cook
Website
Headquarters
Cupertino
Founded
1976
ISIN
ARDEUT116183
FIGI
BBG000S0MRN9
Apple, Inc. engages in the design, manufacture, and sale of smartphones, personal computers, tablets, wearables and accessories, and other varieties of related services. It operates through the following geographical segments: Americas, Europe, Greater China, Japan, and Rest of Asia Pacific. The Americas segment includes North and South America. The Europe segment consists of European countries, as well as India, the Middle East, and Africa. The Greater China segment comprises China, Hong Kong, and Taiwan. The Rest of Asia Pacific segment includes Australia and Asian countries. Its products and services include iPhone, Mac, iPad, AirPods, Apple TV, Apple Watch, Beats products, AppleCare, iCloud, digital content stores, streaming, and licensing services. The company was founded by Steven Paul Jobs, Ronald Gerald Wayne, and Stephen G. Wozniak in April 1976 and is headquartered in Cupertino, CA.
Related stocks

Time to buy? Too much negative press. Buy in Fear- Updated 7/7Apple has faced prolonged downward pressure from bearish investors. Despite its best efforts and some dips, the stock has steadily maintained a baseline price of 200 USD. The flag pattern required some adjustments along its path to break out, primarily due to geopolitical issues and economic variabl


$AAPL: Multi-Cycles At PlayResearch Notes
Documenting New Interconnections
Wave properties:
3rd frame of reference
Multi-Cycles
Fibs of broader cycle
Using coordinates of the recent established cycles for predictive/guiding properties:

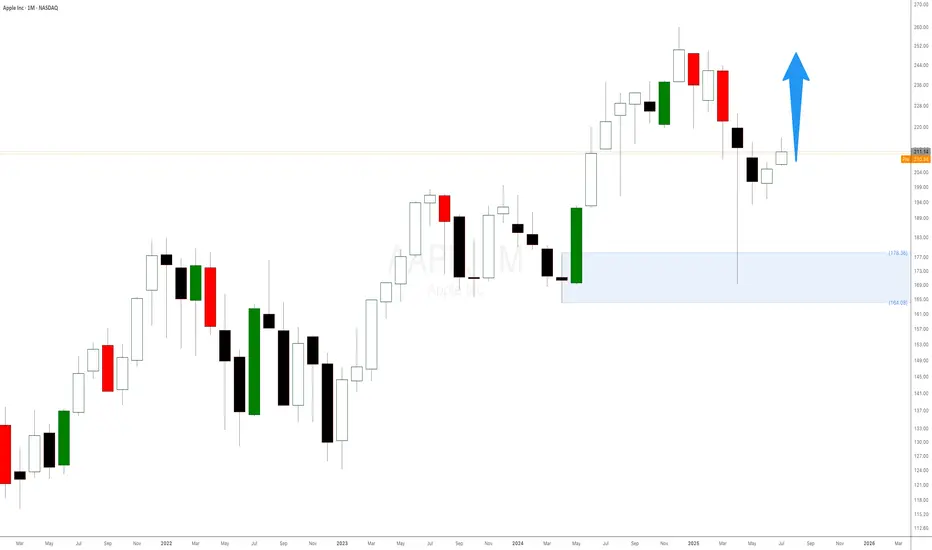
Apple Stock Is Surging! Here’s What Most People MissWhen it comes to trading, we don’t care about the latest news headlines or whether some analyst has upgraded or downgraded Apple stock. We focus on one thing and one thing only: the undeniable forces of supply and demand imbalances on higher timeframes.
Right now, Apple’s monthly chart is a textboo
AAPL – Long Bias SetupWhy I’m Watching the Long Side:
✅ Clean Bounce from $190 Zone
That \$190–195 level has held multiple times since April. Last two dips got scooped with solid demand = solid base forming.
✅ Break of Recent Lower Highs
Stock finally pushed through prior resistance around $205–208. Structure shift. P

Apple's (AAPL) 2009 Long-Term Trendline BounceTechnicals:
After a daily a-b-c to long-term horizontal trendline support, when we zoom out, we can see Apple's 2009 Long-Term Trendline Bounce.
Monthly Chart:

AAPL needs to break above 213 to start an upward moveAAPL needs to break above 213 to start an upward move
From our previous analysis, the price increased by almost +8% from 200 to 216.
The resistance zone, which was also our first target, stopped the price near 213.50, but again the bullish volume seems to be high and there is a good chance that A

Light at the end of the Tunnel for AAPLI have been tracking this pattern that NASDAQ:AAPL started forming in April for some time now.
This is a classic symmetrical triangle formation with significant consolidation in the last trading sessions. This patterns typically lead to a breakout in either direction, and since price is near the

AAPL triangle breakout pattern (bullish bias in this case).📈 Chart Pattern Observed:
This is a symmetrical triangle breakout pattern (bullish bias in this case).
Price has broken out or is near breakout above the descending trendline.
Ichimoku cloud thinning and flattening indicates potential bullish momentum building up.
---
🎯 Target Levels Based on

See all ideas
Summarizing what the indicators are suggesting.
Oscillators
Neutral
SellBuy
Strong sellStrong buy
Strong sellSellNeutralBuyStrong buy
Oscillators
Neutral
SellBuy
Strong sellStrong buy
Strong sellSellNeutralBuyStrong buy
Summary
Neutral
SellBuy
Strong sellStrong buy
Strong sellSellNeutralBuyStrong buy
Summary
Neutral
SellBuy
Strong sellStrong buy
Strong sellSellNeutralBuyStrong buy
Summary
Neutral
SellBuy
Strong sellStrong buy
Strong sellSellNeutralBuyStrong buy
Moving Averages
Neutral
SellBuy
Strong sellStrong buy
Strong sellSellNeutralBuyStrong buy
Moving Averages
Neutral
SellBuy
Strong sellStrong buy
Strong sellSellNeutralBuyStrong buy
Displays a symbol's price movements over previous years to identify recurring trends.
US37833DZ0
APPLE 20/50Yield to maturity
6.94%
Maturity date
Aug 20, 2050
US37833EF3
APPLE 21/51Yield to maturity
6.84%
Maturity date
Feb 8, 2051
US37833EG1
APPLE 21/61Yield to maturity
6.81%
Maturity date
Feb 8, 2061
US37833EK2
APPLE 21/51Yield to maturity
6.79%
Maturity date
Aug 5, 2051
US37833EL0
APPLE 21/61Yield to maturity
6.78%
Maturity date
Aug 5, 2061
US37833DW7
APPLE 20/50Yield to maturity
6.76%
Maturity date
May 11, 2050
US37833EA4
APPLE 20/60Yield to maturity
6.64%
Maturity date
Aug 20, 2060
US37833DQ0
APPLE 19/49Yield to maturity
6.52%
Maturity date
Sep 11, 2049
US37833EE6
APPLE 21/41Yield to maturity
6.23%
Maturity date
Feb 8, 2041
US37833BA7
APPLE 15/45Yield to maturity
6.09%
Maturity date
Feb 9, 2045
US37833DD9
APPLE 17/47Yield to maturity
6.07%
Maturity date
Sep 12, 2047
See all AAPLC bonds
Curated watchlists where AAPLC is featured.


