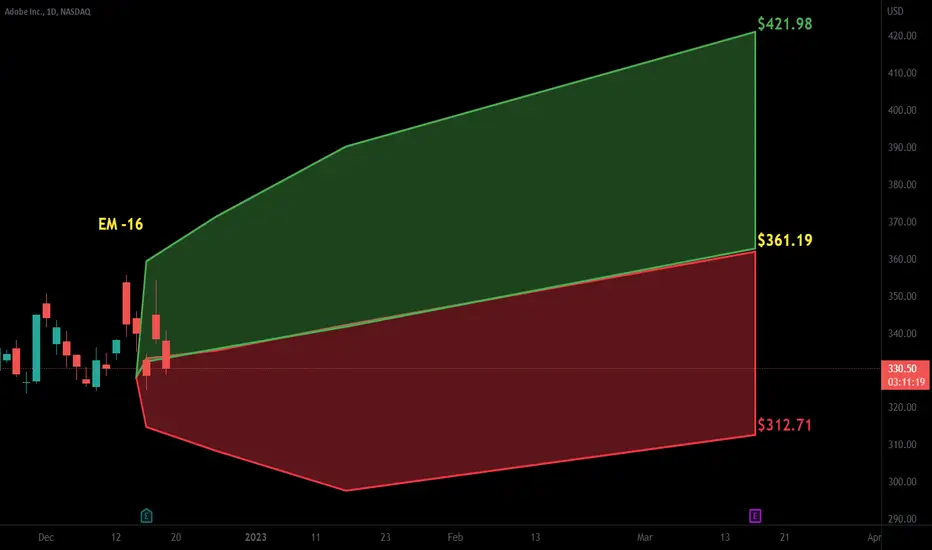
Adobe (ADBE) - Hidden bullish divergence On the chart, we can see a hidden bullish divergence. This means that the price will probably increase in the next coming period. Also, the gap needs to be filled and the earning announcement looks positive, these suggestions are in line with the hidden bullish divergence.
So an entry can be taken when the price breaks to the upside. Take your profits at the targets. All further details are shown on the chart.
Goodluck!
ADBED trade ideas

Adobe’s deal on the verge of cancellation right before earningsShares in Adobe Inc (symbol ‘ADBE’) have been slowly gaining back part of the losses incurred last month while the company is expected to report its earnings for the fiscal quarter ending Feb 2023 on Wednesday 15th of March, after market close. The consensus EPS is $2.97 compared to the result for the same quarter last year of $2.84.
‘Adobe’s share price had a sharp decline in mid February due in part to the U.S. Department of Justice’s plans to block its $20 billion acquisition of Figma, an online design tool & software.’ said Antreas Themistokleous, an analyst at Exness ‘ As of 2nd of December 2022 the company had a current ratio of 111% meaning they have the ability to repay their short term liabilities with the current assets currently available while the total assets exceed total liabilities by more than $14 millions. This shows that the financials of the company look healthy while the estimated EPS is the highest of the last 4 quarters.‘
On the technical side the price is trading in a “dynamic area” between the 50 and 100 day moving average and is currently facing resistance on the 38.2% of the Fibonacci retracement. The $350 price area is considered a strong technical resistance because it is made up of the 38.2% of the Fibonacci, is a round number and is also an inside resistance area that the price reacted to in mid November and mid December!
If the price resumes its recent bearish movement the first point of support could possibly be found around $336 which consists of the 100 day moving average and the 50% of the daily Fibonacci retracement level.

EW analysis - Adobe ready to bull again?Today I want to take a look at Adobe because I think it could soon become interesting again.
First we want to take a look at the long term picture. We can see that in november 2021 a decade long bull run found its end. On log chart we can definitely mark this bull run as a wave 3.
The ensuing correction is than wave 4 of a supercycle.
The interesting question is, if this wave for has already ended or wether there is more to come to the downside.
I think that wave 4 is finished for two important criteria are met.
Wave 4 almost reached the trough of the preceding wave 4 of one degree lower.
Wave 4 already retraced 61.8 oft the preceding wave III
Either way in the medium to short term more gains should follow. Then in september or october we will see which direction adobe will take.
So here are both options:
The bullish variation, which I favor although the last move up doesn't like a convincing impulse.
And here the bearisch variation in which the previous move down was only wave A of an even deeper correction. In this case Adobe might even half.


Is Adobe headed lower?Adobe has been climbing after a sharp slide last year, but now traders may start to worry about another move to the downside.
The first pattern on today’s chart is the peak on February 2, one day after Jerome Powell’s “disinflation” comment lifted spirits. ADBE pushed above its September high of $396.39 but didn’t hold. That kind of false breakout could suggest bears remain in control.
Second, prices have remained below the candle since, resulting in a potential “abandoned baby” pattern.
Third, the software company closed under its 21-day exponential moving average (EMA) for the first time since January 6. Is the short-term trend weakening?
Next, the 200-day simple moving average (SMA) has been falling and remains above the 50-day SMA. That could mean the longer-term trend is still bearish.
Finally, the relative strength index (RSI) is knifing down from an overbought condition.
TradeStation has, for decades, advanced the trading industry, providing access to stocks, options, futures and cryptocurrencies. See our Overview for more.
Important Information
TradeStation Securities, Inc., TradeStation Crypto, Inc., and TradeStation Technologies, Inc. are each wholly owned subsidiaries of TradeStation Group, Inc., all operating, and providing products and services, under the TradeStation brand and trademark. TradeStation Crypto, Inc. offers to self-directed investors and traders cryptocurrency brokerage services. It is neither licensed with the SEC or the CFTC nor is it a Member of NFA. When applying for, or purchasing, accounts, subscriptions, products, and services, it is important that you know which company you will be dealing with. Please click here for further important information explaining what this means.
This content is for informational and educational purposes only. This is not a recommendation regarding any investment or investment strategy. Any opinions expressed herein are those of the author and do not represent the views or opinions of TradeStation or any of its affiliates.
Investing involves risks. Past performance, whether actual or indicated by historical tests of strategies, is no guarantee of future performance or success. There is a possibility that you may sustain a loss equal to or greater than your entire investment regardless of which asset class you trade (equities, options, futures, or digital assets); therefore, you should not invest or risk money that you cannot afford to lose. Before trading any asset class, first read the relevant risk disclosure statements on the Important Documents page, found here: www.tradestation.com .

ADBE Setup for LongADOBE 1H Setup
1- trend was sideways and then broke to upwards
2- because of long consolidation it is expected
that price will shoot up.
3- Next Resistance at 392
4- Entry Points:
-Region1: if price goes above 382
-Region2: 360-365
-Region3: 324-328

Drop to 350s in coming weekADBE needs to establish support near the breakout level before continuing higher.
It’s a bearish Wolfe wave with near term downside to at least 357

Adobe breaking outMoving averages expanding, trend line on Daily broken, quite a nice set up
Trade safe

BULLISH BREAKOUTADBE just broke out it's huge bull flag looking like it might fill that gap it has next week.
Most breakouts lead to a retest of the previous resistance now support. Looking for a retracement next week to the support area for a bounce back up.
What are your thoughts ? I'd love to have a chat about other high probability setups..

$ADBE Nice Volatility Contraction Pattern (VCP)$ADBE is showing great RS here. It is forming both a flat base and a VCP at the same time. The RS Line has the green dot and the $SPX is below the chart with the orange line where you can see the divergence and RS. The green dots are saying there is RS before price is likely to break-out (thanks @JohnMuchow which has great indicators here on TV).
ADBE is running right up against a declining but flattening 150 Day MA (same as 30-week MA) and area of resistance above. (Horizontal blue line). It is however, above a rising 50 Day MA, 21 Day EMA and 5 Day SMA. I’ve started a ½ size position before it breaks out. With a very tight stop. Ideas, not investing / trading advice.

ABDE longPerfect example of range trading. It's been trading in this range for exactly 2 months, and I think the breakout/breakdown move is coming. I'm long $339.20, targeting the upper trend $356 and possible into the gap fill @365.65. Avwap from August high acting as support ~~$324 which will be my stop loss. Anything below that pushes it to gap fill, which starts @303 and closes at @317.42.

Adobe | dead catis this a long, slow, dead-cat bounce? Probably.
White = Yearly (trend) (scary structure on yearly. don't look... Adobe could test its yearly trend at some point...
Black = Monthly (very little structure on 6mon, 3mon and finally something on monthly to work with.
Grey = Weekly levels (most of the levels in play have been weekly.
Red = Daily.

$ADBE with a Bullish outlook following its earnings #Stocks The PEAD projected a Bullish outlook for $ADBE after a Positive over reaction following its earnings release placing the stock in drift B with an expected accuracy of 45.45%.
Adobe in a flag?Adobe - 30d expiry - We look to Buy at 328.71 (stop at 312.61)
Daily signals are mildly bullish.
Price action is forming a bullish flag which has a bias to break to the upside.
Trend line support is located at 327.
We look to buy dips.
We are trading at oversold extremes.
This stock has seen good sales growth.
50 1 day EMA is at 329.
Our profit targets will be 368.88 and 372.88
Resistance: 355.67 / 365.00 / 380.00
Support: 340.00 / 325.00 / 320.20
Disclaimer – Saxo Bank Group.
Please be reminded – you alone are responsible for your trading – both gains and losses. There is a very high degree of risk involved in trading. The technical analysis , like any and all indicators, strategies, columns, articles and other features accessible on/though this site (including those from Signal Centre) are for informational purposes only and should not be construed as investment advice by you. Such technical analysis are believed to be obtained from sources believed to be reliable, but not warrant their respective completeness or accuracy, or warrant any results from the use of the information. Your use of the technical analysis , as would also your use of any and all mentioned indicators, strategies, columns, articles and all other features, is entirely at your own risk and it is your sole responsibility to evaluate the accuracy, completeness and usefulness (including suitability) of the information. You should assess the risk of any trade with your financial adviser and make your own independent decision(s) regarding any tradable products which may be the subject matter of the technical analysis or any of the said indicators, strategies, columns, articles and all other features.
Please also be reminded that if despite the above, any of the said technical analysis (or any of the said indicators, strategies, columns, articles and other features accessible on/through this site) is found to be advisory or a recommendation; and not merely informational in nature, the same is in any event provided with the intention of being for general circulation and availability only. As such it is not intended to and does not form part of any offer or recommendation directed at you specifically, or have any regard to the investment objectives, financial situation or needs of yourself or any other specific person. Before committing to a trade or investment therefore, please seek advice from a financial or other professional adviser regarding the suitability of the product for you and (where available) read the relevant product offer/description documents, including the risk disclosures. If you do not wish to seek such financial advice, please still exercise your mind and consider carefully whether the product is suitable for you because you alone remain responsible for your trading – both gains and losses.

RectangleEarnings 12-15 AMC.
It looks like most analysts are positive on earnings numbers.
Price is under the 50% level of the trend up but above the .618.
Neutral until broken.
No recommendation.

ADBE Adobe Inc Options Ahead Of EarningsLooking at the ADBE Adobe Inc options chain ahead of earnings , i would buy the $325 strike price Puts with
2023-01-20 expiration date for about
$17.25 premium.
If the options turn out to be profitable Before the earnings release, i would sell at least 50%.
Looking forward to read your opinion about it.

$ADBE Short Idea Macro
Micro
As we see $ADBE challenging her main downtrend line therefore I can assemble a low-risk high reward trade.
Main reasons :
1) Trendline meeting
2) Double-top pattern
3)Market profile (since the gap-up) POC at 330
4)Close below 100 EMA
My main idea in nowadays market is bearish and that's leading me to take a more bearish approach X.X
Final notes :
I'm only interested in this trade if $ADBE will show me more weakness at 2.12.22 (Friday)
𝘠𝘰𝘩𝘢𝘪 𝘋𝘦𝘫𝘰𝘳𝘯𝘰 𝘛𝘳𝘢𝘥𝘦 𝘐𝘥𝘦𝘢𝘴

ADOBE predictions until 2036This might be the only 14yr TA available for Adobe... I'm happy to do 14yr TA charts at your request. These are serious TA's and take a solid 5mins to draw up.
you are welcome.

ADOBE shortNot to late to go short, all confirmations check, rupture of the support, pullback and now a flag pattern. I'm going to entry short now, but wait until the flag's break is a good option too

Adobe nasdaq adbe 1 month longAdobe nasdaq adbe 1 month long
monero adobe 1 ay long dayısı hadi
chart long short patladı

Weekly trade setup in ADBE for christmas/january effect rally$ADBE The wolfe wave indicator is increasing in popularity as we continue to see more people using it and enjoying the results. There is a massive setup for a gap fill 425 before filling any of the gaps above. The gaps that are above will likely fill on the next earnings run up or early January 2023.
The weekly setup was triggered the last week of October and chopped into CPI and PPI reports. The projected target is calculated by extending a linear line between pivot 1 and 4 and projecting the line. This is represented as the green perforated line, as shown in the chart. The projected target is around 458 with estimated time of arrival sometime last week of January 2023. Stops would be considered if the daily price closes under the 6 day ma. I hope all of you bank on this!

ADBE weekly bullish setup$ADBE The wolfe wave indicator is increasing in popularity as we continue to see more people using it and enjoying the results. There is a massive setup for a gap fill 425 before filling any of the gaps above. The gaps that are above will likely fill on the next earnings run up or early January 2023.
The weekly setup was triggered the last week of October and chopped into CPI and PPI reports. The projected target is calculated by extending a linear line between pivot 1 and 4 and projecting the line. This is represented as the green perforated line, as shown in the chart. The projected target is around 458 with estimated time of arrival sometime last week of January 2023. I hope all of you bank on this!

#ADBE to 450$?Hello dear Traders,
Here is my idea for #ADBE
Price closed above yellow line (previous month high)
Price closed (15min Chart) above purple trigger line to enter trade.
Targets marked in the chart (black lines)
Invalidation level marked with red line
Good luck!
❤️Please feel free to ask any question in comments. I will try to answer all! Thank you.
Please, support my work with like, thank you!❤️
