ADBE trend line breakAdobe broke a downtrend today in a move that signals rising investor confidence in the software company. Adobe has an 8.4/10 analyst summary score and is rated undervalued by S&P Capital IQ.
ADBED trade ideas

ADBE ShortEven with price being up 10$, shorts still look valid because that gap will eventually need filled and it should correct to the second trend line based on ichimoku and price structure

ADBE trend reversal after price breaks through prior Res/SupDoes this sound like it could pay off at all? ;)

Trade breakout off a cup with handle (?)This is my first (proper ish) trade plan that I have recorded ;>
Anything fundamentally wrong with it?


ADOBE - DAY TRADEHi, today we are going to talk about ADOBE
We observe a 15M, some important points. The details are highlighted above.
Thank you for reading and leave your comments if you like.
Join the Traders Heaven today, for more exclusive contents!
Link bellow!
Disclaimer: All content of Golden Dragon has only educational and informational purposes, and never should use it as financial advice

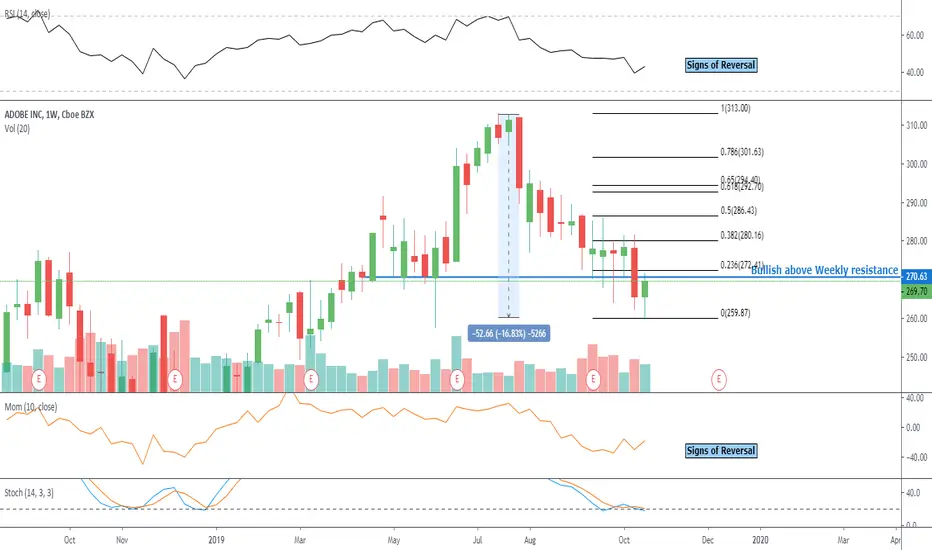
$ADBE Alert set for move above $272Weekly resistance sits at $270, a move above could be a nice entry level for sizable gains, a reasonable upside target is at approx $290
The majority of high valuation cloud stocks have suffered quiet a selloff since the summer highs, it looks like the bottom may be in for the sector.

almost ready for longeither it chooses to recover from here or a false break out like last time then recover.


ADBE for week Oct 14Vela martillo invertido que hacee rompimiento y movimiento gancho para posible continuacional alza. 200EMA plana, cruce positivo de MAs rapida en D junto con MACD positivo y RSI 50. CALL si da senal de continuacion en la apertura con posibles salidas en 285.70, 289, 293. Si vuelve a ingresar al canal bajista quedarse quieto y esperar reaccion del precio en 200EMA.


ADBE | 1HR | Watchlist for options tradingNext weeks watchlist: ADBE.
This will be interesting to watch.
The price spiked right above the 200ma red line.
Seems to be building a good support on it.
it's primed for another move upwards

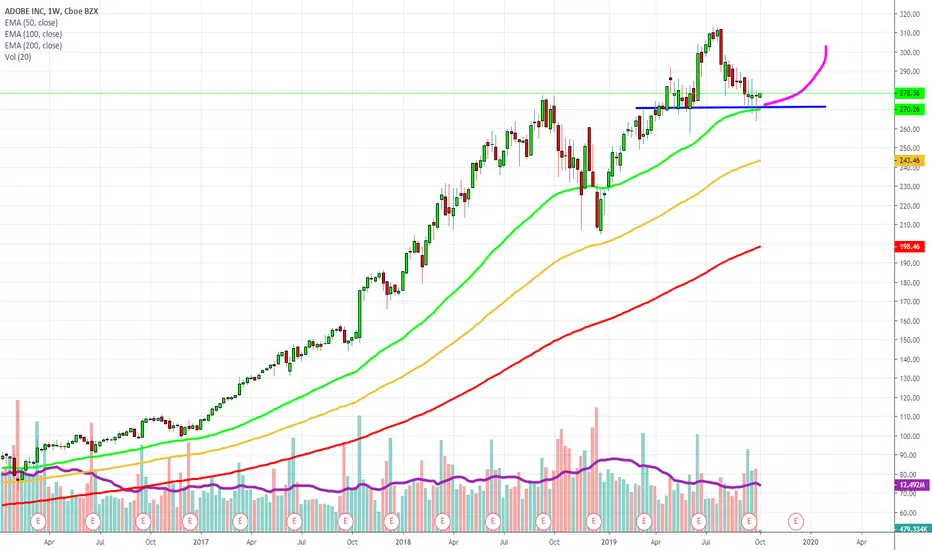
ADBE bounce off the 50-day on the weekly chartADBE bounce off the 50-day on the weekly chart - 270 seems to be a support.

Look for Adobe to follow through on yesterday's breakoutYesterday Adobe broke upward through a downward-sloping trend line. Today it pulled back, but weak volume on the pullback suggests the stock will follow through. As a software company, Adobe is relatively insulated from the earnings recession afflicting other parts of the tech sector. Adobe beat analyst estimates on its recent earnings report, which is what's moving the stock upward. Earnings guidance was a little softer than analysts expected, but the forecast of 20% growth is still very respectable. Adobe has a 9/10 Equity StarMine Summary Score and is rated somewhat undervalued by S&P Capital IQ. Its P/E of 50 is high for the sector, but pretty standard for a growing mega-cap company. Adobe is about 10% off its high from July.

ADBE Short since yesterday's closing Target $262ADBE Short since yesterday's closing Target $262, broke support yesterday. Earnings around a corner may get pushed another 10% down if the report is not satisfactory.

ADBE: Post-earnings analysisThis analysis focuses on the quarterly results (in term of Revenues, Gross profit, Operating income, Net income and the relative margins) just announced by the company and how these are better/worse than the results of the same quarter of 12 months before (called Year-over-Year analysis).
Furthermore, this analysis also takes into consideration if the results in term of Revenue and EPS (Earnings Per Share) have been better than analysts’ expectations.
Read full analysis on BullDude.com

ADBE long setupADBE’s innovation outlook is trending up based on a current score of 77 out of 99, outperforming sector average. Jobs growth over the past year has decreased and insiders sentiment is negative. ADBE is an Outperformer in terms of sustainability. It is most exposed to WPP plc as its supplier. Over the past 4 quarters ADBE beat earnings estimates 3 times. For more analysis and articles visit our website .

A short chart pattern for ADBEI identified a falling wedge or a downtrend asymmetrical triangle that has been developing since August 2019. After the breakout from the pattern, an entry upon its retracement to the resistance line.
Entry : 279.74
Exit : 280.03
I exited with a loss because I just realized the risk is too big for me at the moment. I sold a call credit spread and the max loss is so skewed.


$ADBE Loves The .618 Retracement: Broken Symmetrical TriangleSee Callouts on Chart. Please Like, Comment, and Follow to show your support :)
Check out my homies pages here for more great analysis:
www.tradingview.com
www.tradingview.com
Goodluck!

ShortClean break and retest of triangle. If S&P continue downward our level 2 targets may be reached fairly easily
