C3.ai (AI) Shows Signs of Wyckoff AccumulationAI Stock (C3.ai)
C3.ai (Ticker: AI) is currently trading just above key long-term support levels, exhibiting behavior that closely aligns with the Wyckoff Accumulation model. The stock has shown resilience after a prolonged downtrend and is now forming a potential accumulation base near its recent l
−450 ARS
−285.93 B ARS
385.31 B ARS
About C3.ai, Inc.
Sector
Industry
CEO
Thomas M. Siebel
Website
Headquarters
Redwood City
Founded
2009
ISIN
AR0979595433
FIGI
BBG01V30Q588
C3.ai, Inc. engages in the provision of enterprise artificial intelligence software for digital transformation. It delivers the C3 AI suite for developing, deploying, and operating large-scale AI, predictive analytics, and Internet of Things applications in addition to a portfolio of turn-key AI applications. It operates through the following geographical segments: North America, Europe, The Middle East, and Africa, Asia Pacific, and Rest of World. The company was founded by Thomas M. Siebel, Patricia A. House and Stephen Maurice Ward, Jr. on January 8, 2009 and is headquartered in Redwood City, CA.
Related stocks

Is C3.ai the Quiet Giant of Enterprise AI?C3.ai (AI), an enterprise artificial intelligence software provider, has operated somewhat under the radar despite its foundational role in delivering advanced AI solutions to large organizations. While the broader AI market has seen significant attention on hardware innovators, C3.ai has steadily s

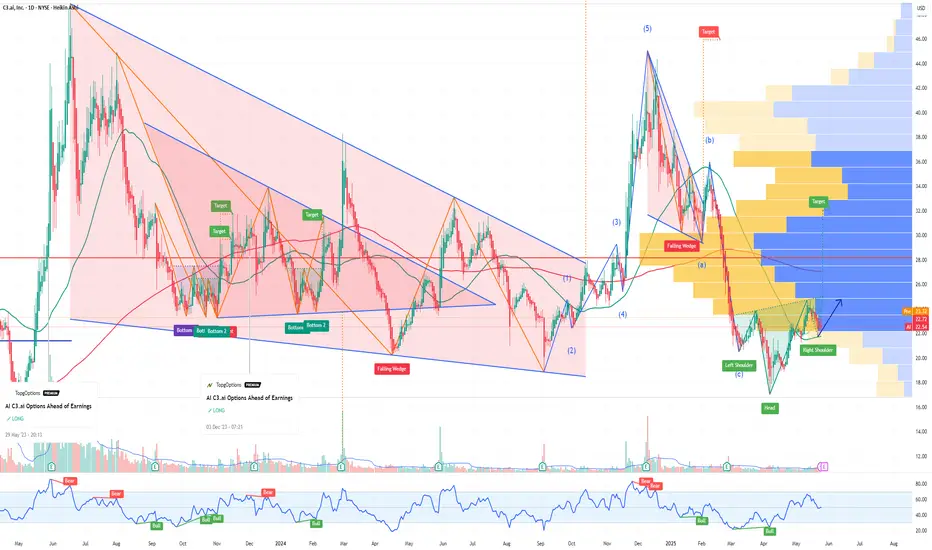
$AI is setting up for a 30% move!C3.AI - NYSE:AI Trade Setup
Inverse H&S Breakout that is now retesting.
A bounce here would confirm the breakout and lead to a MM up to $32.59 for a 30% move!

AI: Round 2AI
The market is really just that simple — it goes around in circles with the same style.
Will you catch AI and go up round 2?
.
US STOCKS- WALL STREET DREAM- LET'S THE MARKET SPEAK!

SPY, SPX, IWM, Natural Gas, NVDA, XYZ, AI - Analysis- Markets sold off into the NVDA rally this morning.
- Small afternoon rally turned indices back green
- Major pre market high levels up ahead likely allow us to push higher in coming days.
- NVDA should retest its premarket high levels.
- Profits secured on AI calls!
- Structurally indices are

AI C3ai Options Ahead of EarningsIf you haven`t bought AI before the previous earnings:
Now analyzing the options chain and the chart patterns of AI C3ai prior to the earnings report this week,
I would consider purchasing the 23.5usd strike price Calls with
an expiration date of 2025-5-30,
for a premium of approximately $1.31.
If
$AINYSE:AI reports earnings post-market tomorrow.
👀 Watch the pre-market volume closely.
✅ If volume picks up, expecting range to hold (purple line on chart) with a move toward $25–$24.
🚀 Breakout above that could push price to $28–$29.
📊 NYSE:AI remains undervalued — once it clears the $30 zone, p

C3.AI has bottomed and is targeting $39.00C3.ai (AI) has been trading within a Channel Down pattern since the June 16 2023 High and right now is testing its 1D MA50 (blue trend-line) as Support, following a bottom (Lower Lows) rebound on April 08 2025.
This is technically the start of its new Bullish Leg, even though based on May - August

AI (C3.ai) – Bullish Reversal Setup on 30-min Chart!
📊 Trade Setup Summary
Pattern: Falling wedge breakout → Potential bullish reversal
Entry: Around $21.87 (breakout area, marked with yellow circle)
Stop-Loss (SL): $21.28 (below key support zone in white)
Target 1 (TP1): $22.92 (red resistance line)
Target 2 (TP2): $24.22 (green resistance zone)

AI: When?AI: When?
-Tweetzer candle pattern.
-Consolidation in tight range at the bottom with low supply volume.
.
Wait for break soon!
US STOCKS- WALL STREET DREAM- LET'S THE MARKET SPEAK!

See all ideas
Summarizing what the indicators are suggesting.
Oscillators
Neutral
SellBuy
Strong sellStrong buy
Strong sellSellNeutralBuyStrong buy
Oscillators
Neutral
SellBuy
Strong sellStrong buy
Strong sellSellNeutralBuyStrong buy
Summary
Neutral
SellBuy
Strong sellStrong buy
Strong sellSellNeutralBuyStrong buy
Summary
Neutral
SellBuy
Strong sellStrong buy
Strong sellSellNeutralBuyStrong buy
Summary
Neutral
SellBuy
Strong sellStrong buy
Strong sellSellNeutralBuyStrong buy
Moving Averages
Neutral
SellBuy
Strong sellStrong buy
Strong sellSellNeutralBuyStrong buy
Moving Averages
Neutral
SellBuy
Strong sellStrong buy
Strong sellSellNeutralBuyStrong buy
Curated watchlists where AI is featured.
