Short - AMDTime period for this play : week to months
Analysis : Elliot wave 12345 ABC. Expect hitting .618 and bounce back up to go higher.
Pattern if wave B completed : Head & Shoulder
Price Target: Wave ABC
ETA Timeline for correction. Please refer to the chart.
Upcoming events:
Tariff active on 8/1/25 -
125 ARS
1.50 T ARS
23.61 T ARS
About Advanced Micro Devices Inc
Sector
Industry
CEO
Lisa T. Su
Website
Headquarters
Santa Clara
Founded
1969
ISIN
ARBCOM4601M3
FIGI
BBG00W7W4738
Advanced Micro Devices, Inc. engages in the provision of semiconductor businesses. It operates through the following segments: Data Center, Client, Gaming, and Embedded. The Data Center segment includes server-class CPUs, GPUs, AI accelerators, DPUs, FPGAs, SmartNICs, and Adaptive SoC products. The Client segment refers to the computing platforms, which are a collection of technologies that are designed to work together to provide a more complete computing solution. The Gaming segment is a fundamental component across many products and can be found in APU, GPU, SoC or a combination of a discrete GPU with another product working in tandem. The Embedded segment focuses on the embedded CPUs, GPUs, APUs, FPGAs, and Adaptive SoC products. The company was founded by W. J. Sanders III on May 1, 1969 and is headquartered in Santa Clara, CA.
Related stocks

AMD Analysis! Bullish 🔷 📝 AMD Analysis – GEN Methodology & Fibonacci Projection NASDAQ:AMD
✅ Chart Technique:
The blue overlay represents a historical price pattern (GEN Projection) applied to the current AMD chart using Bar Pattern Projection.
This technique forecasts potential timing and price movement based on si

Why I Went Long on AMD Near the 2025 Lows🔍 Reason for the Trade
This wasn’t just a “buy the dip” setup — this was a calculated trade based on strong confluence:
✅ Multi-Year Demand Zone
Price returned to a massive support level that’s held since 2020. This zone had previously triggered multiple large bullish reversals.
✅ Falling Wedge Br

7/15 AMD short AMD just reached a major resistance level and is expected to pull back toward the $135 area. While it may not signal a full trend reversal, a retracement from today’s high is likely.
If the 7/15 candle forms a red shooting star, it would provide further confirmation.
May the trend be with you.

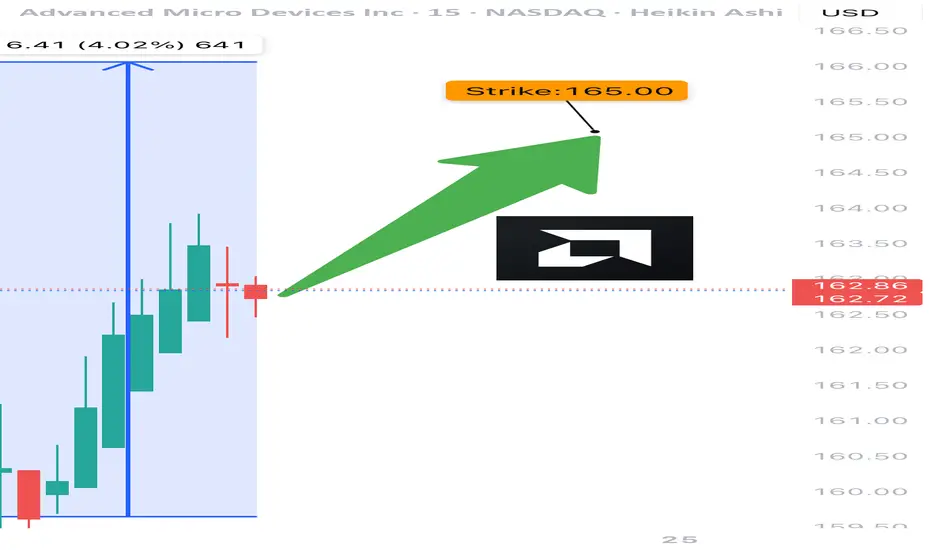
AMD TRADE ALERT (07/24)
🚨 AMD TRADE ALERT (07/24) 🚨
Options flow is screaming bullish 📈
🧠 Key Insights:
• Call/Put Ratio: 1.80 (🔥 heavy call bias)
• RSI: Daily 75.5 / Weekly 77.2 = strong momentum
• Volume = weak ⚠️ but sentiment remains bullish
• High gamma risk = explosive potential near expiry
💥 TRADE IDEA
🟢 Buy AMD
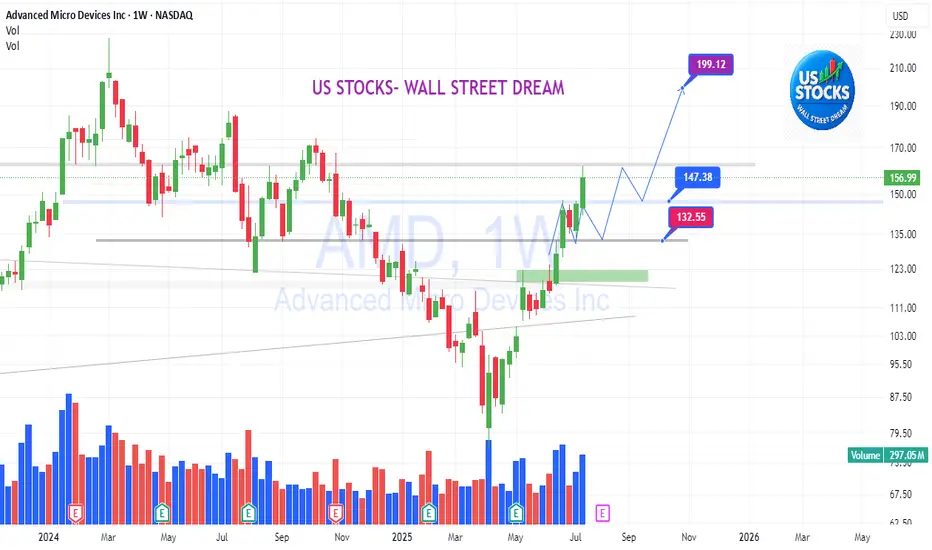
AMD 1W: If Not Now — Then When?The weekly chart of AMD looks like it’s holding its breath: a well-defined falling wedge, double bottom support, and price pressing right against long-term trendline resistance. Everything’s in place — now it just needs to break and run, preferably without tripping over nearby Fibonacci levels.
The

AMD enters new bullish rangeAMD has entered the bullish range I called for recently. I believe this will be a strong consolidation zone before new all-time highs. BBWP and stochastic will overheat here and need to reset. My target for the year is 235$.

AMD: Potential Mid-Term Reversal from Macro SupportPrice has reached ideal macro support zone: 90-70 within proper proportion and structure for at least a first wave correction to be finished.
Weekly
As long as price is holding above this week lows, odds to me are moving towards continuation of the uptrend in coming weeks (and even years).
1

Elliott Wave Outlook: AMD Expects Pullback Soon Before RallyThe Advanced Micro Devices Inc., (AMD) favors rally in impulse Elliott Wave sequence from 4.09.2025 low & expect upside in to 168.36 – 190.36 to finish it. Impulse sequence unfolds in 5, 9, 13, 17…., swings & ends with momentum divergence. In daily, it ended pullback in 3 swings at 75.22 low in blue

AMD: Next movements!AMD: Next movements!
Necessary backtest to rest, assess supply and demand, and reinforce the trend.
Wait to get on board with plan.
US STOCKS- WALL STREET DREAM- LET'S THE MARKET SPEAK!
See all ideas
Summarizing what the indicators are suggesting.
Oscillators
Neutral
SellBuy
Strong sellStrong buy
Strong sellSellNeutralBuyStrong buy
Oscillators
Neutral
SellBuy
Strong sellStrong buy
Strong sellSellNeutralBuyStrong buy
Summary
Neutral
SellBuy
Strong sellStrong buy
Strong sellSellNeutralBuyStrong buy
Summary
Neutral
SellBuy
Strong sellStrong buy
Strong sellSellNeutralBuyStrong buy
Summary
Neutral
SellBuy
Strong sellStrong buy
Strong sellSellNeutralBuyStrong buy
Moving Averages
Neutral
SellBuy
Strong sellStrong buy
Strong sellSellNeutralBuyStrong buy
Moving Averages
Neutral
SellBuy
Strong sellStrong buy
Strong sellSellNeutralBuyStrong buy
Displays a symbol's price movements over previous years to identify recurring trends.
AMD5426832
Advanced Micro Devices, Inc. 4.393% 01-JUN-2052Yield to maturity
6.05%
Maturity date
Jun 1, 2052
AMD5426831
Advanced Micro Devices, Inc. 3.924% 01-JUN-2032Yield to maturity
4.58%
Maturity date
Jun 1, 2032
AMD6026360
Advanced Micro Devices, Inc. 4.319% 24-MAR-2028Yield to maturity
4.16%
Maturity date
Mar 24, 2028
AMD6026359
Advanced Micro Devices, Inc. 4.212% 24-SEP-2026Yield to maturity
4.07%
Maturity date
Sep 24, 2026
See all AMD bonds
Curated watchlists where AMD is featured.


