AMD Stable Channel Up targets $168.Advanced Micro Devices (AMD) has been trading within a Channel Up since the April 08 market bottom. With the 4H MA50 (blue trend-line) as its Support since April 30, the pattern has shown incredible consistency, with the past two pull-backs almost touching the 0.382 Fibonacci retracement level.
As a result, given also the fact that the 4H RSI is supported by the Higher Lows trend-line, we view the current bounce as a solid buy opportunity for the short-term. We are targeting $168, which is the -0.5 Fibonacci extension, the level that the previous Higher High reached.
-------------------------------------------------------------------------------
** Please LIKE 👍, FOLLOW ✅, SHARE 🙌 and COMMENT ✍ if you enjoy this idea! Also share your ideas and charts in the comments section below! This is best way to keep it relevant, support us, keep the content here free and allow the idea to reach as many people as possible. **
-------------------------------------------------------------------------------
💸💸💸💸💸💸
👇 👇 👇 👇 👇 👇
AMDC trade ideas

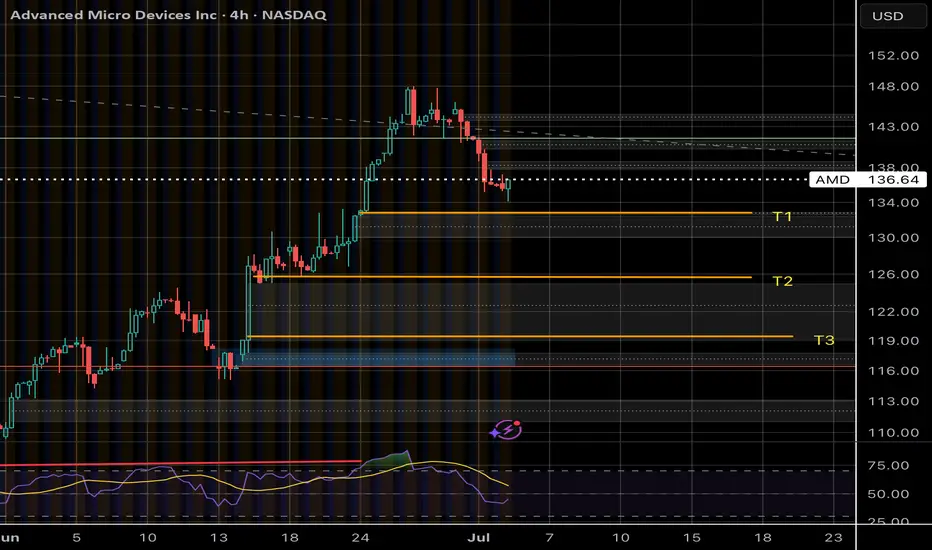
AMD If; ThenIf price goes below T1 I’ll be shorting to T2 and T3 as price fills gaps. As with my Bart pattern scalps, once price reaches a gap fill area it is quite reliable in direction
Reversal on AMDI have a very simple analysis on AMD. As you see from this chart, we have seen in the past at points 1 and 2 that after a brutal bearish trend, the stock has rebounded at subsequent earnings. Assuming today's Earnings are also a beat, which I expect them to be, We will see a nice trend reversal on this stock. This stock has been beaten, kicked for a while now and I believe based on the past instances, we will see it rally up. The question is rally how much? Only time will tell, but given the Earnings are a beat, we won't see the stock go down like it happened the last earnings call.

AMDAMD is in a nice channel and should be bought at the lows of the channel so this look's like a good time to get long.

HERE IS THE #CHART $AMD Bullish with consolidation risk. Advanced Micro Devices ( NASDAQ:AMD ) is at $143.81, up 0.09% daily and 25.14% monthly, as shown in the finance card above. X posts highlight strong momentum, with a breakout above the 200-day SMA ($129.74) and a potential Wave 5 targeting $154-$160, supported by analyst upgrades (Mizuho, Melius to Buy; targets $140-$175). AI chip demand (MI350 outperforming Nvidia’s B200, Oracle/Zettascale deals) and 40% YoY revenue growth drive optimism. However, a high P/E (105.42) and choppy price action suggest a possible pullback to $141.63-$142. Support is at $141.63; resistance is at $147.75-$150. A break above $147.75 could target $154; a drop below $141.63 risks $138

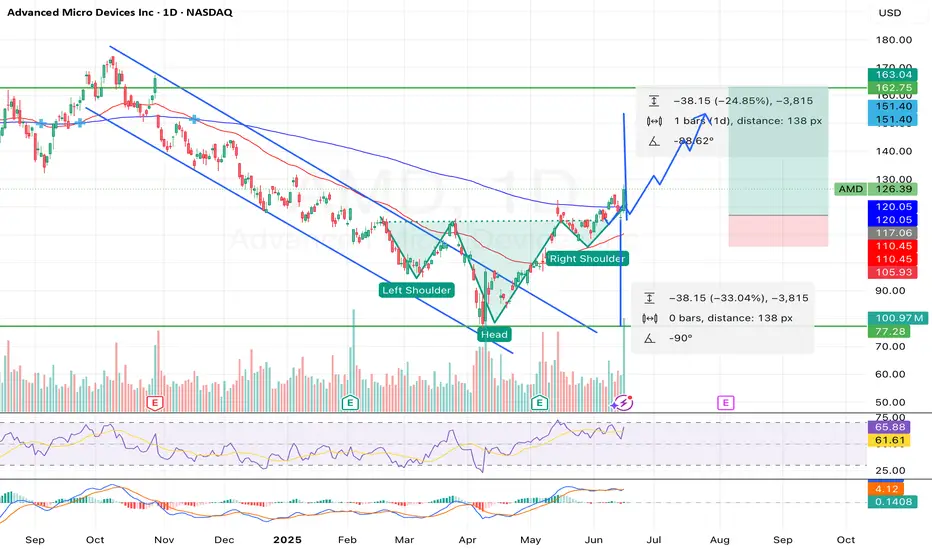
Breakout Alert: AMD Head & Shoulders Points to $160+Overview
Name: Advanced Micro Devices, Inc.
Ticker Symbol: AMD
Exchange: NASDAQ
Founded: 1969
Headquarters: Santa Clara, California, USA
CEO: Lisa Su (as of 2025)Sector: Technology / Semiconductors
About
AMD is a leading semiconductor company known for its high-performance computing and graphics solutions. It competes with Intel and NVIDIA in the CPU, GPU, and data center markets. Its product line includes Ryzen (desktop/laptop CPUs), EPYC (server CPUs), and Radeon (GPUs), with strong expansion in AI and custom silicon for next-gen applications.
Fundamentals
Earnings: AMD reported strong Q1 2025 earnings with a beat on both revenue and EPS, supported by explosive demand in the AI and data center segments.Revenue: $6.52B, up 21% YoY
Outlook: The company raised guidance for the second half of 2025 as it expects to benefit from the AI chip boom and new product rollouts.
Technicals (4H Chart)
Inverted Head and Shoulders pattern confirmed with neckline breakout around ~$117
Breakout from Falling Channel aligning with bullish reversal structure
Price surged past resistance with strong volume, currently at $126.39 (+9.71%)
RSI at 65.88, approaching overbought but not signaling weakness
MACD bullish crossover, confirming momentum
Short-term target range: $145–$150, with extended projection up to $162.75
📌 Support Levels: $117, $111.50📈 Target Price (TP): $162.75 (based on pattern breakout height projection)
💡 My Take
AMD just pulled off a textbook bullish reversal — inverted head and shoulders breakout combined with a falling channel exit. With strong macro trends in AI hardware and data center expansion, this move feels well-supported fundamentally and technically.
The clean neckline breakout and explosive candle suggest continuation. I am expecting a potential consolidation around $130–$135ish before next leg to $150+. If momentum holds, $162+ is possible before August.
💼 Position
Type: AMD 145 Call
Expiry: July 03, 2025
Quantity: 15
Average Cost Basis: $.038
Date Purchased: June 12, 2025
Last Price: $0.47
Total % Gain/Loss: +23.4%
I entered after the neckline break and riding the wave. AMD’s setup is too clean to ignore — high conviction play.
$AMD – Major Support Flip?📊 Technical Analysis
NASDAQ:AMD looks poised for a breakout continuation, with multiple technical signals aligning:
Price recently flipped major historical support/resistance (~$132.75–133.18), a level that has acted as a launchpad multiple times in the past (highlighted by the boxed reactions).
After a strong rally, a pullback into this zone (marked by the arrow) would be healthy and may offer a prime long opportunity if the level holds.
Bullish projection targets a move toward the next key resistance area around $184.52, followed by a long-term fib extension / prior high zone at $226–227.60.
Structure remains clean – bullish continuation pattern after a breakout from a prolonged range.
⚙️ Macro & Fundamental Drivers
🧠 AI & Data Center Tailwinds
AMD continues to be a major beneficiary of the AI boom, especially with its MI300X AI GPU chips entering competition with Nvidia's offerings.
Big cloud customers (Microsoft, Meta, Amazon) are increasing adoption of AMD’s accelerators in 2025 deployments.
Analysts are increasingly bullish on AMD’s data center market share gains in 2H 2025.
💼 Earnings Momentum
Strong recent earnings report beat both revenue and EPS expectations.
Forward guidance remains upbeat, driven by AI, custom silicon, and embedded segments.
Gross margins expanding — indicating strong operational leverage.
📉 Rate Cut Hopes + Tech Rotation
Markets are pricing in Fed rate cuts late 2025, improving sentiment for high-beta tech.
Institutional flows are rotating back into semiconductors after a Q2 pullback.
🇺🇸 CHIPS Act Support
U.S. government funding continues to support domestic chip production, indirectly benefiting AMD by bolstering its supply chain and CapEx plans.
🎯 Trade Setup
Entry Zone: $133–138 (retest zone / support flip)
Stop Loss: Below $130
Target 1: $184.52
Target 2: $203.71
Target 3 (Stretch): $226–227
⚠️ Risks
Macro risks: Unexpected Fed hawkishness or broader tech selloff.
Competitive risks from Nvidia or delays in data center adoption cycles.
📌 Conclusion
NASDAQ:AMD is retesting a critical structural level with strong bullish momentum. With the AI narrative heating up, macro tailwinds forming, and technicals aligned, this could be the next major breakout candidate in the semiconductor space.

AMD – The AI Underdog Setting Up for a Major MoveAMD is quietly building momentum as a major AI contender, rivaling NASDAQ:NVDA with its upcoming MI400 GPU series and strong Q2 guidance potential.
I'm watching this carefully for a medium-term swing with high reward potential based on both fundamental catalysts and technical structure.
🔍 Entry Points I'm Watching:
✅ $143 → Aggressive breakout entry if it clears $147.50 with strong volume
✅ $125 → Previous support + gap-fill zone from May
✅ $115 → Deep value zone near 200-day MA (if macro weakens)
🎯 Profit Targets:
• TP1: $160 – Key resistance & post-earnings reaction zone
• TP2: $176 – Melius Research target
• TP3: $200+ – ATH breakout potential if AI narrative extends into Q3
⚡ Catalysts to Watch:
• MI400 GPU launch in progress
• Q2 earnings (late July) – data center revenue in focus
• Sector momentum from NASDAQ:MU and NASDAQ:NVDA
⚠️ Disclaimer: This is not financial advice. I am sharing my personal trading plan and analysis for educational and discussion purposes only. Always do your own research and consult with a financial advisor before making investment decisions

Amd - This is just the beginning!Amd - NASDAQ:AMD - perfectly plays out:
(click chart above to see the in depth analysis👆🏻)
Despite the harsh drop of about -65% which we have been witnessing starting back in 2024, Amd remains bullish. Just three months ago, Amd retested a textbook confluence of support. We saw bullish confirmation, the bottom is in and Amd will rally significantly from here.
Levels to watch: $200, $300
Keep your long term vision!
Philip (BasicTrading)

2025/06/25 Portfolio UpdateDue to the fee structure provided by the chosen broker, the fees proportion is too high. The portfolio will only the swing model.
Entry Prices:
AMD - $129.51, 3.0577
NVDA - $152.42, 2.9445
Is AMD Poised to Redefine the Future of AI and Computing?Advanced Micro Devices (AMD) is rapidly transforming its market position, recently converting a Wall Street skeptic, Melius Research, into a bullish advocate. Analyst Ben Reitzes upgraded AMD stock to "buy" from "hold," significantly raising the price target to \$175 from \$110, citing the company's substantial progress in artificial intelligence (AI) chips and computing systems. This optimistic outlook is fueled by a confluence of factors, including surging demand from hyperscale cloud providers and sovereign entities, alongside colossal revenue opportunities in AI inferencing workloads. Another upgrade from CFRA to "strong buy" further underscores this shifting perception, highlighting AMD's new product launches and an expanding customer base, including key players like Oracle and OpenAI, for its accelerator technology and the maturing ROCm software stack.
AMD's advancements in the AI accelerator market are particularly noteworthy. The company's MI300 series, including the MI300X with its industry-leading 192GB HBM3 memory, and the newly unveiled MI350 series, are designed to deliver significant price and performance advantages over rivals like Nvidia's H100. At its "Advancing AI 2025" event on June 12, AMD not only showcased the MI350's potential for up to 38x improvement in energy efficiency for AI training but also previewed "Helios" full-rack AI systems. These comprehensive, plug-and-play solutions, leveraging future MI400 series GPUs and Zen 6-based EPYC "Venice" CPUs, position AMD to directly compete for the lucrative business of hyperscale operators. As AI inference workloads are projected to consume 58% of AI budgets, AMD's focus on efficient, scalable AI platforms puts it in a prime position to capture a growing share of the rapidly expanding AI data center market.
Beyond AI, AMD is pushing the boundaries of traditional computing with its upcoming Zen 6 Ryzen CPUs, reportedly targeting "insane" clock speeds, well above 6 GHz, with some leaks suggesting peaks of 6.4-6.5 GHz. Built on TSMC's advanced 2nm lithography node, the Zen 6 architecture, developed by the same team behind the successful Zen 4, promises significant architectural improvements and a substantial increase in performance per clock. While these are leaked targets, the combination of AMD's proven design capabilities and TSMC's cutting-edge process technology makes these ambitious clock speeds appear highly achievable. This aggressive strategy aims to deliver compelling performance gains for PC enthusiasts and enterprise users, further solidifying AMD's competitive stance against Intel's forthcoming Nova Lake CPUs, which are also expected around 2026 and feature a modular design and up to 52 cores.

$AMDNASDAQ:AMD buyers are stepping in around $150/share
As tech continues to expand, investors are leaning toward high-quality plays and NASDAQ:AMD is positioned as a leader in next-gen semiconductors and AI infrastructure.
Momentum could build from here if demand holds strong.

Big move for AMD monday inverted H&S greatly confirmed 150USD!!!The pattern have been greatly confirmed for me and i will sell my amd this week at 150 USD and i will wait at july when a drop will occurs to rebuy and i will cumulate more stock or more profits in cash.
The information and publications are not meant to be, and do not constitute, financial, investment, trading, or other types of advice or recommendations.
Thank you!
Subcribe TSXGanG! (For real chart)

AMD Wave Analysis – 25 June 2025
- AMD rose above the resistance level 136.16
- Likely to rise to resistance level 150.00
AMD recently broke the resistance zone between the resistance level 136.16 (former strong support from 2024) and the 61.8% Fibonacci correction of the downward impulse from last October.
The breakout of this resistance zone accelerated the active short-term impulse wave 3, which belongs to the multi-month upward impulse sequence (3) from the start of April.
AMD can be expected to rise to the next resistance level 150.00, former monthly high from November and the target for the completion of the active wave (3).

AMD Major Lower Highs/ 1W MA50 break-out.It was only 9 days ago (June 16, see chart below) when we called for a potential bullish break-out on Advanced Micro Devices (AMD) above the 1W MA50 (blue trend-line):
The break-out did happen, this 1W candle is already considerably above its 1W MA50 and based also on the level the 1W RSI is at right now, it may resemble more the March 13 2023 1W candle instead of the January 30 2023 as previously thought.
The reason is the major break-out of the All Time High (ATH) Lower Highs trend-line that came along with the 1W MA50. As you can see, it was on the March 13 2023 1W candle that AMD broke above that trend-line with the 1W RSI being on the same level (66.00) as today.
This candle formed a short-term Top, with the price initiating a 1.5 month pull-back that re-tested the 1W MA50 as Support and then moved on to complete the +143.12% Bullish Leg from the Channel Up bottom.
As a result, we can't rule out the first wave of short-term profit taking by next week. But a potential 1W MA50 test, will be another long-term buy entry in our view. Our $185.00 Target remains intact.
-------------------------------------------------------------------------------
** Please LIKE 👍, FOLLOW ✅, SHARE 🙌 and COMMENT ✍ if you enjoy this idea! Also share your ideas and charts in the comments section below! This is best way to keep it relevant, support us, keep the content here free and allow the idea to reach as many people as possible. **
-------------------------------------------------------------------------------
💸💸💸💸💸💸
👇 👇 👇 👇 👇 👇

AMD – Choppy Structure May Confirm Full ABC Correction From $76AMD surged from $115 to $130 with strong volume, but failed to attract follow-through buying interest. Since May 20, price action has become increasingly choppy and indecisive.
This raises the probability that the entire move from $76 may be forming a completed ABC corrective structure.
A sustained drop below $125 would test the diagonal base. If broken, it could expose $116 and $110 as next downside targets.

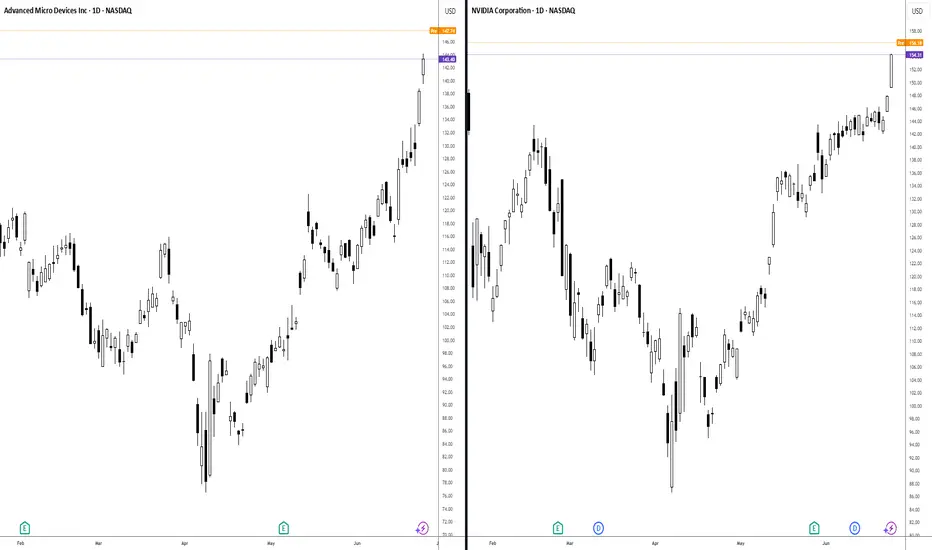
The next Intel or the next Nvidia?Neither, AMD has it's own path with destiny. The cyclical nature of semiconductors makes this an interesting stock to analyse through TA. The fundamentals remain strong, whilst they are clearly behind Nvidia and Broadcom, there's also closely following behind and have a far smaller market cap. In a risk on mode, I think this offers far better upside than a 3 trillion dollar Nvidia stock.
It looks like much of Nvidia's stock price has been baked in the revenue growth into the stock price. Not even an earnings beat was enough to satisfy investors. People are panicking, 10 year yields are dropping, the market is in freakout mode.
Meanwhile, AMD remains bearish, there is no doubt about that. The question is where is the bottom?
I have a very strong buy zone here at $91-100. I think the risk to reward here is quite compelling. Using stop losses to minimise potential capitulation, risk management would have saved a lot of headache for anyone who has purchased since 06/03/24, almost a year ago, as they are down on their position and were better taking a small calculated loss.
Not financial advice, do what's best for you.


AMD Trade Thesis – Navigating the Derivatives DimensionNASDAQ:AMD continues its calculated ascent through equilibrium, now challenging the upper liquidity void. Today's Smart Money Concepts chart reveals a breakout from the discount range, aligning with institutional footprints and volume confirmation.
🧠 WaverVanir DSS Forecast:
📍 Current: $129.58
🔄 15-Day Projection: $127.91 (−1.3%)
📈 30-Day Projection: $132.32 (+2.1%)
🧪 Sentiment Score: 40.9 → Calm confidence, no euphoria. Perfect conditions for silent positioning.
📐 Chart Outlook:
Equilibrium passed; acceleration toward imbalance zones likely.
Resistance above at:
$150 → Institutional anchor
$169.56 → Strong liquidity cluster
$226.38 → Final Fibonacci expansion (1.618 level)
📊 Strategic Alignment:
This is not a pursuit of capital—it’s a derivative strategy aligning time, volatility, sentiment, and fractal geometry. Money is the echo. We move with the source.
We don’t chase the surface—we code the undercurrent. Derivatives are our dimension, and AMD is the current signature.
🔐 This post is for informational and educational purposes only—not financial advice. Always manage your risk in accordance with your strategy.
#AMD #QuantTrading #SmartMoney #SMC #AITrading #WaverVanir #VolanX #Derivatives #DSS #MarketPrediction #Fibonacci #Leadership #StrategicLiquidity #OptionsFlow #TradingView #WaverVanirInternational

AMD: Second round trip!AMD: Second round trip!
How did you enjoy the journey, are you ready for round 2?
.
US STOCKS- WALL STREET DREAM- LET'S THE MARKET SPEAK!

Inverse head and shoulders complete The price has completed the formation of an inverse head and shoulders pattern and is preparing for an upward movement.
The price has already tested the neckline; the breakout above $132 will initiate the bullish trend

Powerful AMD Trade Opportunity BreakdownAs I was going through AMD’s daily chart today, something stood out — and not in a subtle way. Amid a steady bullish trend, the June 16 candle formed a clean imbalance, opening up a textbook Fair Value Gap (FVG) that screams institutional activity.
This gap offers a clear zone of interest — between $126.58 and $117.88 — where smart money might be eyeing positions. That’s where my focus locked in.
But it didn’t stop there. I dug deeper and spotted an incredible bounce off support from August 5, 2024 — lining up perfectly with the zone. That’s not coincidence. That’s structure.
With the Squeeze Momentum showing light green and AlgoPro Support & Resistance confirming an uptrend, the case builds stronger. If momentum stays bullish on the lower timeframes, this could be our green light to strike.
Targets are clear:
📍 TP1: $132.80
📍 TP2: $135.70
And true to the VEP Trader Strategy (Vision, Execution, Precision), I’ll be dropping into 5M or 2M charts — watching for a liquidity sweep, a FVG confirmation, and a solid EMA retest.
No guessing. No hype. Just clean structure, liquidity, and calculated confirmation.
#AMDStock #DayTradingSetup #TechnicalAnalysis #SmartMoney #VEPStrategy #FairValueGap #LiquidityZones #MomentumTrading #SqueezeMomentum #TradingCommunity #StockMarketEducation #TradingSetup #TradeWithPrecision #SwingTradeIdeas #SniperEntry #PriceActionTrading #TradeSmart #InstitutionalTrading #StockAnalysis #MarketBreakdown

AMD IS READY FOR A STRONG BULLISH MOVENASDAQ:AMD Right now, am extremely bullish on AMD.
I expect AMD to give a good bullish run to trail NVIDIA.
Technically, AMD is supper bullish right now, having had a multiple bullish break of structure on the daily time frame.
I took a long entry on the bullish break of structure on daily time frame. Stop loss is below the recent structure swing low.
What do you see on your chart?
