Nvidia - How Long Will It LastHello Traders, welcome to today's analysis of Nvidia.
--------
Explanation of my video analysis:
All the way back in February of 2014 we saw a breakout of a long term symmetrical triangle on Nvidia. This breakout was followed by an insane +9.500% rally towards the upside. Right now Nvidia is trading in a solid ascending channel and is approaching the upper resistance trendline. I do expect a (short term) pullback from there to retest the support mentioned in the analysis.
--------
I will only take a trade if all the rules of my strategy are satisfied.
Let me know in the comment section below if you have any questions.
Keep your long term vision.
AMDC trade ideas

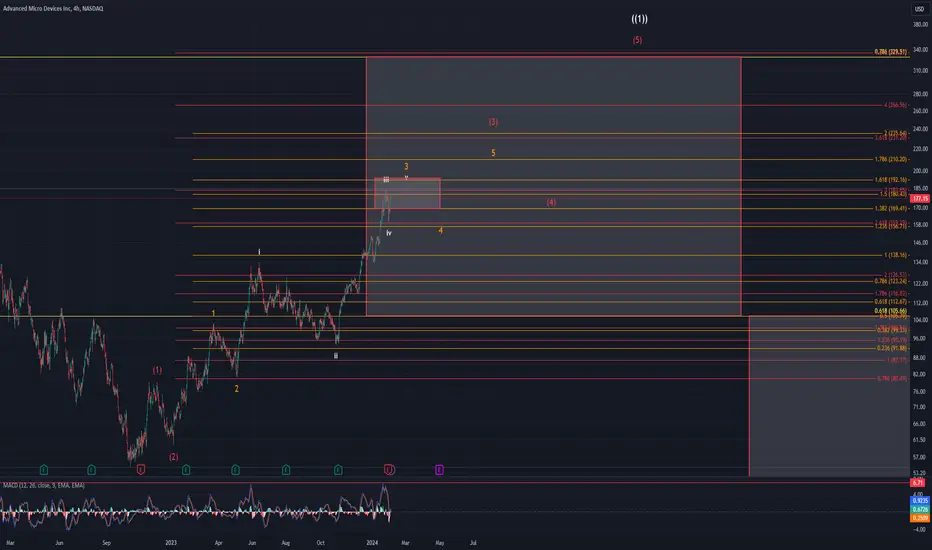
AMD Update: 02/04/2024AMD has been on a tear for a while now. This recent little retrace we had I am counting as wave iv of 3 of (3). In the wave iii of 3 of (3), price went from $93.12 all the way to $184.92 in 3 months. That is the strength of 3's when they get stacked like they were. To say this thing is extended is an understatement. I anticipate us to raise to the $190's before starting our next retrace for wave 4.
Once we start that wave 4, I can give more refined targets for that retrace, but until then I would only be speculating. After that wave 4, price should head to the $210-$230 area if it is to continue along these extensions. Broadcom is already being considered as a replacement for Tesla in the magnificent 7. If investors make that conclusion, then it would be a huge boost to AMD and would easily give it the momentum necessary to hit the targets I have set. Time will tell but I feel AMD is a great long-term investment and I will most likely be buying into it very soon. If/when I do, I will post those trades on here of course.
AMD - Starting to Accumulate.AMD - Currently down 50% from ATH starting a position for long-term.
Looking to add at levels of support indicated in cyan. Big bids at 59-50 and 34-29.
Short-term trend change if yellow zone gained. Targeting orange around 100 for profit taking.
Looking for new ATH on gain of purple.

Advanced Micro Devices (AMD): A Promising Future in AIAdvanced Micro Devices ( NASDAQ:AMD ) emerges as a compelling investment option poised for significant growth in 2024. As the demand for artificial intelligence (AI) and graphics processing units (GPUs) continues to surge, NASDAQ:AMD 's strategic moves and recent product unveilings indicate a promising trajectory. We delve into the factors driving NASDAQ:AMD 's potential for a soaring stock performance in the coming year.
1. AI Market Growth and AMD's MI300X Breakthrough:
The AI market, valued at nearly $200 billion in the previous year, is projected to witness a staggering compound annual growth rate of 37% through 2030, reaching over $1 trillion. AMD, recognizing this immense potential, unveiled its latest powerhouse, the MI300X GPU, in December. Positioned to challenge Nvidia's dominance, the MI300X promises to be a game-changer, offering competitive performance for training and surpassing Nvidia's H100 for inference by 10% to 20%. This strategic move positions NASDAQ:AMD as a formidable player in the rapidly expanding AI sector.
2. Strategic Partnerships with Tech Giants:
NASDAQ:AMD 's foray into AI is reinforced by strategic partnerships with industry giants, enhancing its market presence and credibility. Microsoft, a key ally with a close partnership with OpenAI, announced its adoption of NASDAQ:AMD 's new GPU in Azure, optimizing AI capabilities. This collaboration not only underscores AMD's technological prowess but also positions the company favorably in the cloud computing domain. With a similar agreement in place with Meta Platforms, NASDAQ:AMD secures a foothold among tech's most influential players, setting the stage for sustained growth.
3. Improved PC Market and Revenue Surge:
Beyond the AI realm, NASDAQ:AMD is capitalizing on a gradually improving PC market. Data from Gartner reveals a 0.3% increase in global PC shipments in Q4 2023, marking the first positive growth in over a year. This trend aligns with NASDAQ:AMD 's financial performance, as evidenced by a 42% YoY rise in revenue in its client segment during Q3 2023, reaching $1.4 billion. As macroeconomic headwinds subside, NASDAQ:AMD is poised to leverage a resurging PC market, contributing to its stellar growth outlook for 2024.
4. Earnings-Per-Share (EPS) Projections:
Projections for NASDAQ:AMD 's EPS indicate substantial upside potential, aligning with the company's growth prospects. As the company diversifies its product offerings and strengthens its position in both AI and PC markets, analysts anticipate a significant surge in the stock's value in the next fiscal year. This positive sentiment is further supported by NASDAQ:AMD 's continuous innovation and market responsiveness.
5. Technical Outlook and Investor Sentiment:
From a technical perspective, NASDAQ:AMD is riding a rising trend channel in the medium long term. This positive trend signifies investor confidence and a growing interest in the company's potential. With no apparent resistance in the price chart, the stock's upward momentum is reinforced by strong positive momentum. While acknowledging the potential for overbought conditions, the absence of resistance and the ongoing positive trend suggest further room for growth.
Conclusion:
In conclusion, Advanced Micro Devices (NASDAQ: NASDAQ:AMD ) stands at the forefront of a transformative era in semiconductor technology, driven by the burgeoning demand for AI and the resurgence of the PC market. With its MI300X GPU poised to challenge industry leaders and strategic partnerships amplifying its market reach, NASDAQ:AMD is positioned for substantial growth in 2024. As EPS estimates align with the company's potential and technical indicators signal a positive trajectory, investors may find AMD a compelling opportunity for significant returns in the coming year.

Almost ready to take offAMD needs to clear the dashed red line resistance around 140. The yellow/red downward funnel represents selling pressure that it has to escape before making next leg higher. If AMD can't clear the 140 resistance immediately, then it will likely pullback to 132-134. That would be an ideal buying opportunity.
The green upward funnel represents buying pressure. This will take it to new highs and overpower the selling pressure.
Initial upside target = 150-158 by mid to late Jan. 2024 ( point target = 150 by 1/12/2024 )
After initial target is hit, AMD could see brief flat to down before making move to at least 164 (goal target).

AMD - $170 Late Analysis - Uptrend and Good One to Watch I bought in again when AMD just recently (and everything) dropped and sold out at 70% - I wanted to post this but I forgot. AMD, NVDA, Etc are tickers I've been studying for nearly a decade now so I try not going into so many different ones.
Update 1/17-1/18/24: Still Learning how to effectively draw on mobile/computer with TradingView.. Let me know any suggestions but this is what I meant to post yesterday. Any tips and feedback on what would help easily visualize the analysis, let me know! Always want to help and learn from others too!
*KEY*
Original Channel in dotted orange-yellow was draw before the big upsurge, then drew 2nd pattern (blue) and my prediction of price trend before ER in the Green dotted curved arrow. The White dotted arrow shows a possible price trend if there's a delay to $170+.
I would have talked about TSM but I don't like to potentially trigger any FOMO in ER Gambles.
-Comment any feedback, like, dislike, criticize, let me know what you think and happy trading! - JL
Cheers!

AMD chart update, EXTENDED LINES EDITIONChart update, charts linked.
If you're buying long after 171, I warned you.
Orange is Support and future rejection trend.
If we close the week over 137.09
bullish.
39 gonna hit you like a truck if you're not out before the drop (Feb/March maybe, time frame is hard to predict, but I assume the drop ends sometime around May or June.)

AMD EXTENED LINE'S EXTENDED LINE EDITION (CONTINUE OR FALL)If you've been following me with AMD, we're pretty much out at this point, as we've been targeting the trade since 93, and there isn't much point to miss a few extra percentage points on the topside at the risk of losing all or much of the profits.
HOWEVER, there are still trades to the topside, as far as trades heading to the bottom side.
Marked in thick green and thick red are the TWO STRONGEST support and rejection trends I could find. Do more exist? Maybe, but you'll need a better analyst that me to find those.
Light red are steep support trends that have been building on top of each other (stacking)
Think of this like a skyscraper being built.
All indicators point that we are nearing a top. However, this means nothing as short term indicators can theoretically keep pumping the price over the long term targets, which would see numbers at 200+
Notice the time frame of the chart, 2h, meaning it won't last for more than a couple weeks and you'll likely have a whole new set of trends.
A move like this into earnings is going to be the big question.
179
189
are two really strong rejection lines. May not be exact, but close. You really need to analyze in real time at this point because move will happen faster and faster.
I would say, should the price not hold 171.00, I would wait to see what happens in the short term, and try and buy the dip if it occurs pre earnings, with a potential trade before, on or right after earnings. I would then be waiting on topside for a short entry rather than pushing my luck as a bull.
If you follow me with trades, you'll know that we essentially speak in probability. Meaning, at or above 189, I'm more likely to screw up than make a good trade, and if I screw up, there is a lot of downside showing, which will do absolutely nothing to cover the mistake (loss). Having said that, if you're a short term trader and familiar with short term trading, yes there are absolutely still chances to trade above this level should it occur.
We would also say, there is a better than average chance that should I wait for some of these topside targets to hit and enter short, I have a better than average chance to both profit, and make more overall money, than trying to time out more really short term trades.
It's all about profitability, risk, percentages, and patience. Waiting for the RIGHT trade IS 1000% better than jumping into a trade you missed because you have FOMO.
There will almost always be another buy, there will almost always be another stock moving up the percentage you missed. Idk, what it would be called in formal terms, but I call it the sniper strategy.
Good luck!!
I've attached all previous AMD charts to this chart.

Opened: AMD March 15th 145/155/210/220 Iron Condor... for a 3.33 credit.
Comments: High IVR/IV (104.5/60.1) earnings announcement play.
3.33 credit on buying power effect of 6.67; 49.9% ROC at max; 25.0% at 50% max. Delta/theta 2.68/4.65.
So, far TSLA earnings was a small loser; the jury's still out on NFLX (but it's underwater) ... . Third time's the charm?

AMD Weekly Technical AnalysisAMD Weekly - No RECOMMENDATION or ADVICE Status / EDUCATIONAL only - Support, Resistance, Trend Lines, Confluence, Cluster, Parallel Channels, Modify Schiff Pitchfork, Fibonacci Extension - Hope it Helps, Good Luck
DISCLAIMER - This communication is not trading or investment advice, recommendation or solicitation to buy, sell or hold any investment product is provided for informational, educational and research purposes only. All illustrations, forecasts or hypothetical data are for illustrative purposes only. The author or persons involved in the conception, production and distribution of this material cannot be held responsible for transactions or any financial loss or damages resulting directly or indirectly from the use or application of any concepts or information contained in or derived from this material. Past performance is not indicative of future results. Any person who chooses to use this information as a basis for their trading assumes all the liability and risk for themselves.


AMD support level ideasEntry Point: Given the support level at $160-$151 (H&S), entering near this price offers a favorable risk-reward ratio, with significant upside potential to the bullish target of $180 or above.

Market Top Looming For AMDRan through historical data on AMD and have quite a few signals of interest. The first event is bullish and calls for a move into the larger green box. Typically my signals come with a delay until the final movement is achieved. In this case, my Aggressive Multi-time frame indicator fired based on January 22, 2024 closing price. The signal was bullish, however, the common delay sees a retracement into the are of the pink box. Today, AMD moved down into the pink box possibly satisfying the delay prior to moving above the signal price and thus completing the signal.
Although the delay and successful signal have both occurred, the stock cannot trade straight sideways forever. The likely direction is still very bullish, even if the stock were to revisit the small pink box in the next two days. Believing the stock will continue up, the question then becomes how high?
I figure we are in the final end of an impulsive wave C. The five waves in this wave C are the larger Yellow numbers from when the wave began at the low on October 26, 2024. Yellow waves 1-4 are likely completed and we are in the final wave 5 upward now. Some of the common reversal points are highlighted with the wave extension levels on the right. 100% of wave 3's movement is at 151.05 while 200% is at 185.73. A wave 5 typically does not breach the 176.40% level therefore placing a likely top below 177.55.
This yellow wave 5 is composed of five smaller white waves, of which 1-3 are likely completed and it is unknown if wave 4 was completed today too. Wave 4 could complete if there is additional downward movement within the next two days. Once wave 4 is confirmed the final white wave 5 will coincide with the market top. The same levels are interest on the left likely indicate a top below the 114% level. A common top is normally no higher than the 106-110% mark for micro fifth waves. This would likely keep the top below 177.20.
I am not trying to find the top, but more of when the top could occur and what happens afterward. White wave 1 was five days, while wave 3 was six days. White wave 5 will likely be five days or less which is January 30. AMD reports earnings on January 30. There is a chance, either earnings, the outlook or a combination of factors do not fair well for AMD. There could be a final rally during the day on the 30th, until earnings come out after hours. AMD has debt that is due this year and the Fed's decision, but more likely its outlook on rate cuts this year could have a major impact on the refinancing of that debt. AMD could hold off on refinancing their debt if they believe cheaper rates are coming soon. If the Fed takes rate cuts off the table, do not provide a time table for cuts, or state factors enabling rate cuts are yet to be seen will force AMD to refinance their debt at higher rates. This could force them to sell stock (normally at a cheaper price), raise prices (consumers are already squeezed there) or another path not favorable to the short-term profitability.
The earnings fall out will hit the stock on January 31. The Federal Reserve provides the next decision point on January 31. There is another signal that triggered at the close on January 12th that remains unfulfilled. That bearish signal indicated the stock could fall below 146.56 before February 20, 2024 based on historical data. The actual target box for the movement is the large yellow box on the chart. Based on the 383 studied occurrences, the signal is correct 91.361% of the time. Correct in this case would require a movement below 146.56. This instance could fall into the 8+% of failure, or it could occur via a longer path. I am positing AMD could crash down into the yellow box after fulfilling all signal price targets (pink, green, and yellow boxes).
The Fed and earnings are only the beginning of the downward movement. I am still bearish on the market in the short-term (rest of 2024) even though I have called for the drop to occur in the prior months. The market is at new all-time highs, but are things really better than they were on January 3, 2022?

Legendary resistance reached?Lots of downside here, just like NVDA.
Wear a condom (stoploss) please.
Thanks!

AMD Faces Stock Slump Despite Q4 Revenue BeatAdvanced Micro Devices (NASDAQ: NASDAQ:AMD ), a prominent player in the semiconductor industry, recently experienced a sharp decline in its stock value following a weaker-than-expected sales forecast for the first quarter. Despite outperforming analyst predictions in the fourth quarter, AMD's stock slumped as it provided a cautious outlook, particularly for its PC chips and central processing units (CPUs). This article delves into the key factors behind the market's reaction, the company's financial performance, and the potential implications for investors.
The Q4 Revenue Beat:
NASDAQ:AMD reported fourth-quarter revenue of $6.17 billion, slightly exceeding the consensus analysts' estimate of $6.12 billion. The robust performance was driven by substantial year-over-year growth in its data center and client segments, recording 38% and 62% respectively. The surge was attributed to increased demand for Instinct graphics processors used in artificial intelligence (AI) applications and recent chip launches.
Sales Guidance Misses the Mark:
The primary reason for NASDAQ:AMD 's stock decline was its sales guidance for the first quarter of 2024, which fell short of Wall Street expectations. The company anticipates Q1 sales of about $5.4 billion, plus or minus $300 million, below the market consensus of $5.73 billion. The softening demand for PC chips and CPUs contributed to this outlook, raising concerns among investors.
Navigating Challenges in PC Chips and CPUs:
NASDAQ:AMD projects a decline in sales growth for its PC chips business in the first quarter, reflecting the challenges in the current market environment. However, it aims to offset this decline by leveraging growth in graphics processing units (GPUs) sales, emphasizing a focus on the lucrative AI market. The company foresees a significant uptick in 2024 AI GPU chip sales, with a revised projection of $3.5 billion, up from the initial forecast of $2 billion.
Strategic Collaborations in the Cloud Space:
NASDAQ:AMD CEO Lisa Su highlighted the company's collaborations with major players like Microsoft, Oracle, and Meta in the cloud space. Su mentioned working closely with these partners on Instinct GPU deployments for internal AI workloads and external offerings. This strategic positioning in the cloud market suggests that NASDAQ:AMD is actively seeking avenues to capitalize on the growing demand for AI-driven solutions.
Technical Analysis and Support Levels:
Let's also considers the technical aspects of NASDAQ:AMD 's stock performance, noting a potential three-month trendline support around $160. The analysis suggests that failure to hold this key level could signal a possible trend reversal. Investors are advised to closely monitor the stock's movement, especially in light of an earnings-driven retracement.
Conclusion:
While NASDAQ:AMD 's fourth-quarter performance showcased strength in key segments, the market's reaction to the sales forecast for Q1 2024 has raised questions among investors. The company's strategic focus on AI GPU chip sales and collaborations in the cloud space reflects its commitment to adapting to evolving market dynamics.
As the semiconductor industry continues to navigate challenges, investors will be closely watching NASDAQ:AMD 's ability to execute its strategy and maintain its competitive edge in the rapidly changing tech landscape.

The Big 4 Earnings Yesterday - THE RESULTThe Big 4 Earnings today - THE RESULT
✅Google
✅Microsoft
❌Starbucks
✅AMD
See the chart for reported vs estimated and how the price finished up today
▫️ NASDAQ:MSFT a clear leader
▫️ NASDAQ:SBUX missed expectations on both fronts
▫️ NASDAQ:GOOGL & NASDAQ:AMD try to hold ATH

AMD ER: watching another 3 to 6% drop tomorrowHave an ER strangle on AMD.
Looking to exit the puts tomorrow near 150-155.
Have been playing strangles on earnings this season.
Will update this tomorrow.

AMD targets smashed! time for some updates 🔥boost and follow for more! 💜 October 30th I said "good ER report and rally to 100-120 should come quick! nice support here for AMD 🚀"
well that aged like a fine wine! I will clear my previous lines and levels and let you guys know what I am seeing now! stay tuned.

AMD: Targeting HOP Level at $208.051: Holding 3.618 as SupportLast week during earnings, INTC reversed at the PCZ of a Bearish 5-0 after trading just below the highly contested 50 dollar strike. Now AMD is doing something similar, except its highly contested strike is below it at $170-$175. I find it a little bit more likely that AMD goes for a move up towards the 200 level which would align it with the Bearish HOP level where then one may consider switching to a Bearish bias.
I will be playing it via synthetic longs and vertical spreads
This is an updated Post after realizing that AMD just filled a gap visible on the daily, I also felt like reposting it on the daily timeframe because after hours activity does not really matter for the options position.

AMD: Targeting HOP Level at $208.051Last week during earnings, INTC reversed at the PCZ of a Bearish 5-0 after trading just below the highly contested 50 dollar strike. Now AMD is doing something similar except it's highly contested stike is below it at $175. I find it a little bit more likely that AMD goes for a move up towards the 200 level which would align it with the Bearish HOP level where then one may consider switching to a Bearish bias.
I will be playing it via options spreads, in a way that gives some credit in order to reduce risks either being a Vertical or a Butterfly call spread though I may increase my risks a bit and go synthetic long.

AMD I am now long PUTS in the money 1x 1.618 is todays peak The chart posted is that of AMD Today I took a net long PUTS at 75 % in the money wave 1 or A x 1.618 is a 173 to 176 target we are now it a top

The 4 Big Earnings Releases For Today (updated later)The 4 Big Earnings Releases For Today
I will update these charts later with there reported earnings and revenue. You can see that NASDAQ:MSFT leads the pack with relative strength.
Premarket Google and Microsoft are showing higher prices whilst Starbucks and AMD are showing lower premarket prices (see orange price bars)
NASDAQ:GOOGL NASDAQ:AMD NASDAQ:SBUX #earnings
PUKA

AMD Update: 01/28/2024I'm sure when I first posted how high my forecast for AMD was most of you scoffed at it. Well, look at where we are now. I still feel we are targeting the 1.382 next @ $193.30. This isn't a requirement though as you can see, we are in the target box. When we hit the top, we will start our wave iv retrace which will bring us to the $150-$160 area before raising again to the low $200's for v of 3. One step at a time though.
MACD has already made a new high for this move up confirming the count. When we do top, I will try to sneak in a couple of puts for the retrace but won't push it. I don't like counter trend trading especially during a wave 3. This week should be interesting to say the least.
