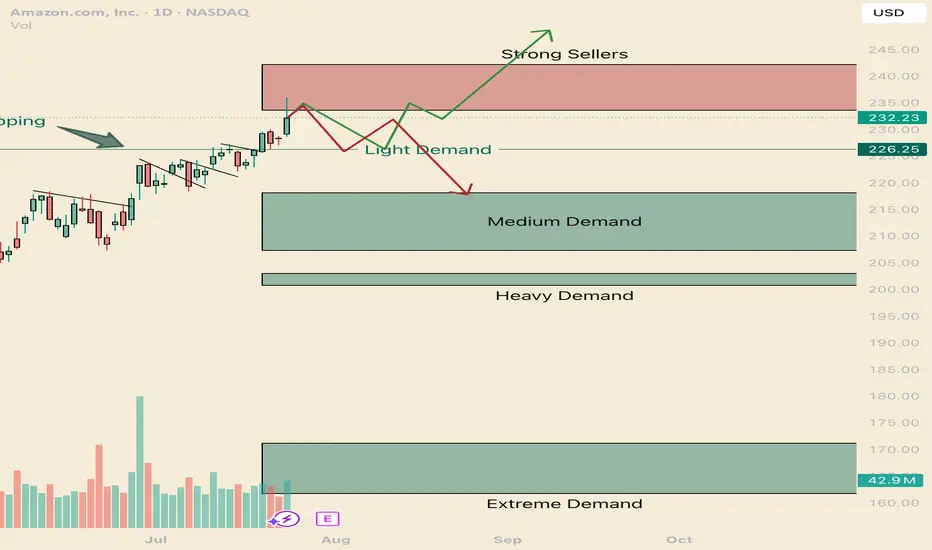
How to navigate the Amazonian Squeeze. AMZNHello I am the Cafe Trader.
This week has been a deep dive on the MAG 7 and today AMZN is up next.
We are going to look at long term and short term opportunities.
We are near the All Time Highs, with one final Seller to get through before making the break.
Today we tested to see if those sellers
Key facts today
50 ARS
54.25 T ARS
584.16 T ARS
About Amazon.com
Sector
Industry
CEO
Andrew R. Jassy
Website
Headquarters
Seattle
Founded
1994
ISIN
ARBCOM460176
FIGI
BBG00P2FT6Y6
Amazon.com, Inc. engages in the provision of online retail shopping services. It operates through the following business segments: North America, International, and Amazon Web Services (AWS). The North America segment includes retail sales of consumer products and subscriptions through North America-focused websites such as amazon.com and amazon.ca. The International segment offers retail sales of consumer products and subscriptions through internationally-focused websites. The Amazon Web Services segment involves in the global sales of compute, storage, database, and AWS service offerings for start-ups, enterprises, government agencies, and academic institutions. The company was founded by Jeffrey P. Bezos in July 1994 and is headquartered in Seattle, WA.
Related stocks
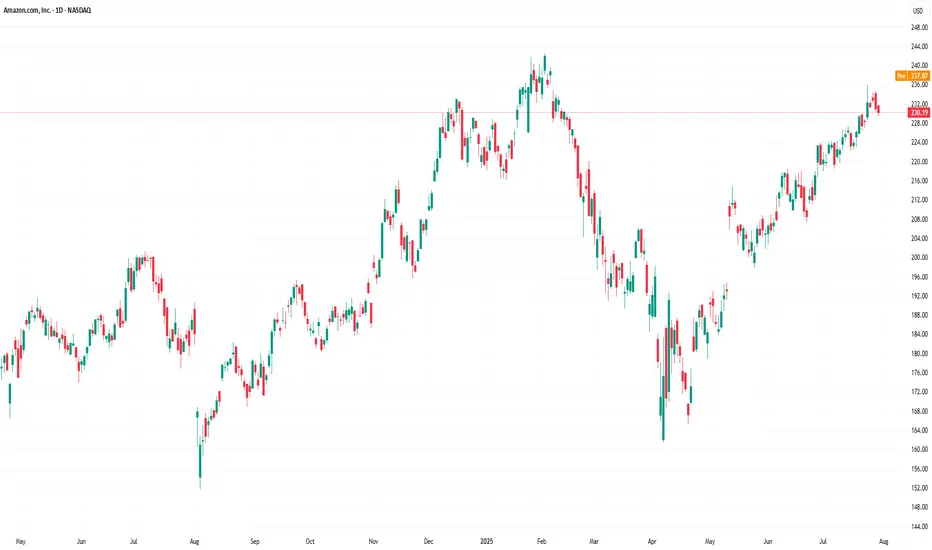
Amazon (AMZN) Shares Rise Ahead of Earnings ReportAmazon (AMZN) Shares Rise Ahead of Earnings Report
Today, 31 July, Amazon is set to release its quarterly earnings after the close of the regular trading session. Available data show that Amazon (AMZN) shares are exhibiting bullish momentum, reflecting positive market expectations:
→ In July, AMZ
Real Sellers Vs Passive Sellers AMZNHello I am the Cafe Trader.
I was fortunate enough to get an editors pick, and I wanted to expound on how I came to those conclusions.
In this video we talk about passive sellers vs aggressive sellers and how we identify them. Also why it's important to identify these players in the market. This

AMZN Earnings Play — July 30 (AMC)
## 🚀 AMZN Earnings Play — July 30 (AMC)
**💵 High Conviction Call Trade | 85% Confidence**
📈 **Amazon (AMZN)** — Cloud + Consumer Power Combo
🧠 Setup driven by earnings momentum, bullish flow, and macro strength.
---
### 🔍 FUNDAMENTALS SNAPSHOT
✅ **Revenue Growth**: +8.6% TTM
✅ **Margins**: Pro

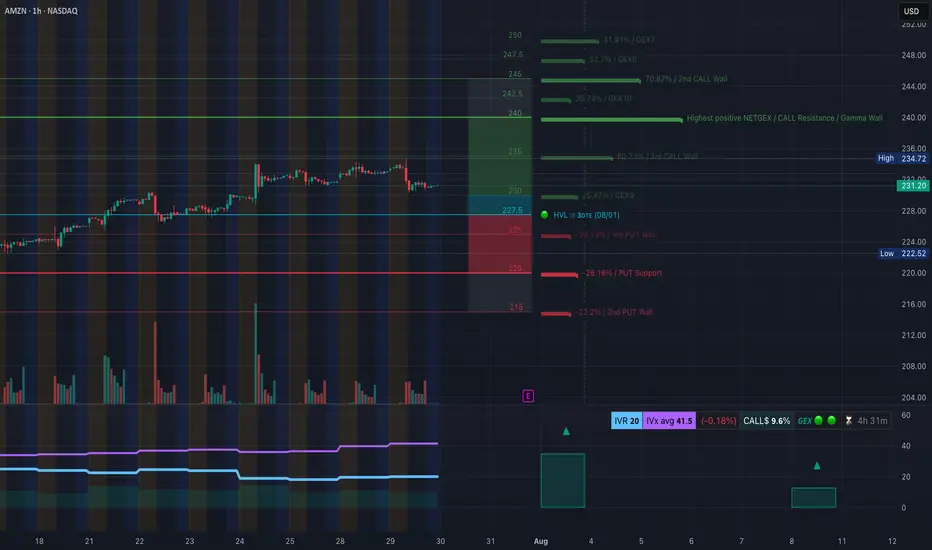
Will $222 Hold or Are We Heading for $215 Flush? July 30AMZN Breakdown in Progress!
🔍 GEX Insights & Options Trading Thoughts (1H Perspective)
Amazon (AMZN) is transitioning from a distribution phase into a potential gamma-driven selloff, and the current GEX setup confirms that bias. The GEX walls are sharply stacked on the downside, while call walls r
AMZN: The Battle for Direction at a Critical JunctureThe recent price action for Amazon (AMZN) is currently navigating a critical juncture, having pulled back from a significant resistance level and now consolidating within a pivotal "Deciding Area." A detailed review of the key technical levels reveals the following insights:
Key Resistance ($240):
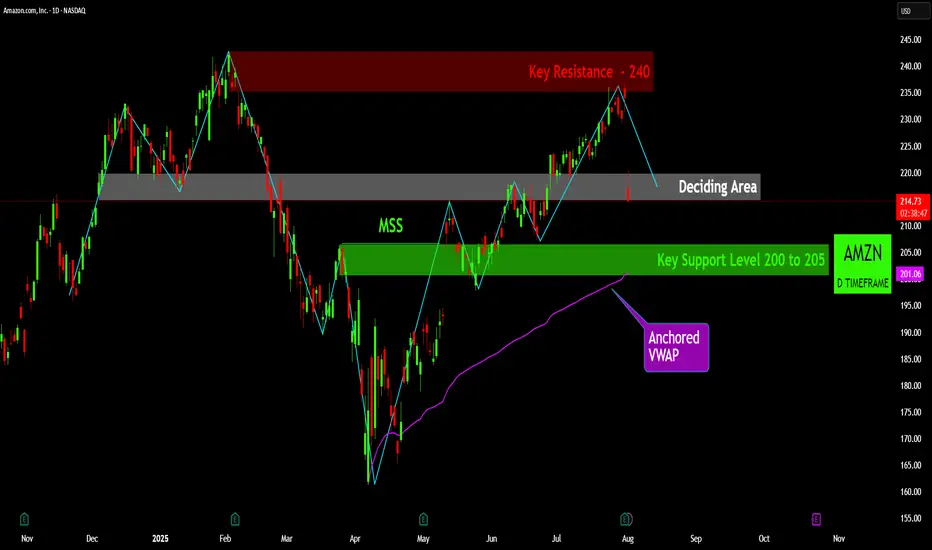
Amazon: Extending the Rally...Amazon maintaines its strong upward momentum. As this trend continues, the large blue wave (V) is expected to complete well above the resistance level at $242.52. However, an alternative scenario with a 30% probability remains on the table: in this case, the magenta corrective wave alt.(2) would p

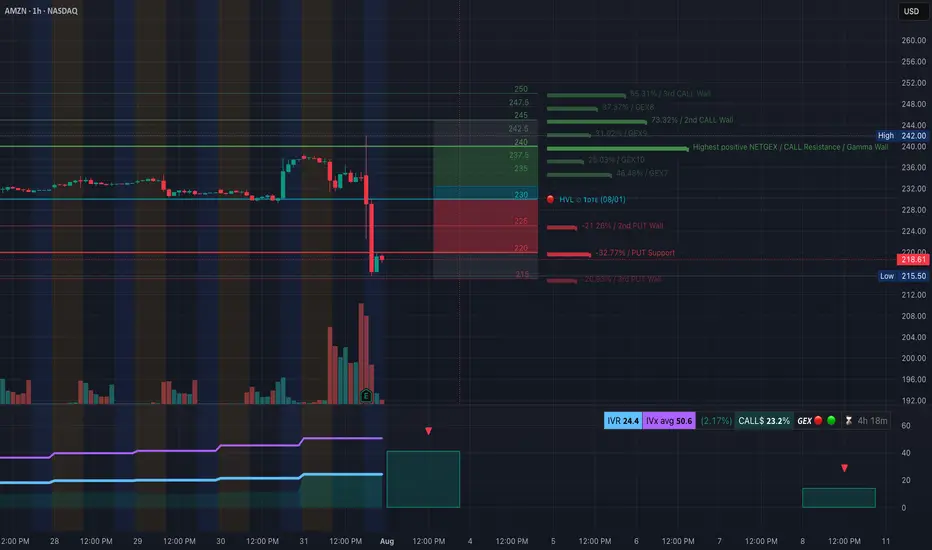
AMZN Earnings Flush — Gamma Flip to the Downside. 8/1AMZN Earnings Flush — Gamma Flip to the Downside, Eyes on $215 Support!
🔍 GEX & Options Flow Insight (1st Image Analysis)
AMZN collapsed post-earnings, breaking through major gamma support levels and flipping into a negative gamma environment. Price is now pressing against a critical $215–218 deman
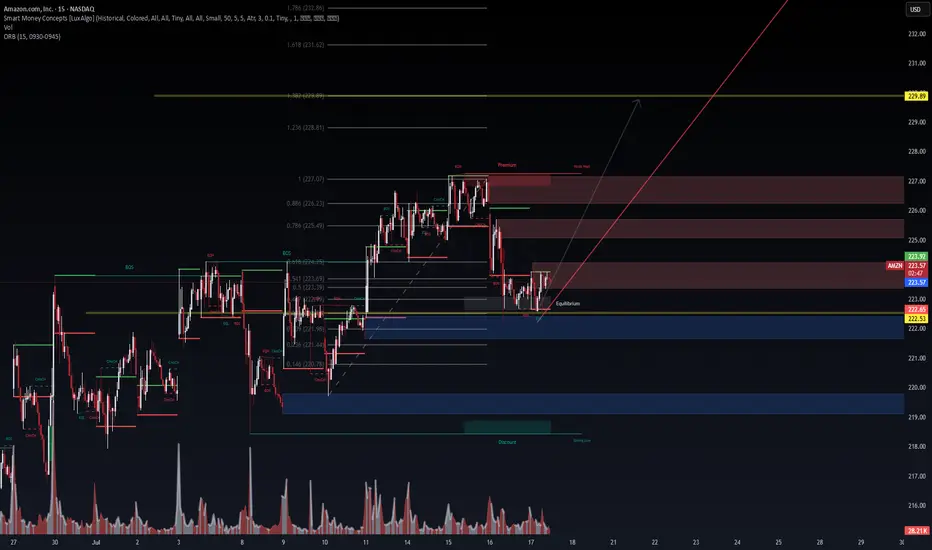
AMZN 15m – Institutional Demand Reclaim in Progress | VolanX Pro📈 AMZN 15m – Institutional Demand Reclaim in Progress | VolanX Protocol Alert
Amazon (AMZN) is staging a potential bullish reversal from a deep discount zone following a strong rejection near the 0.146–0.236 Fibonacci confluence at ~$220.78–221.44. We are now consolidating near the equilibrium zone
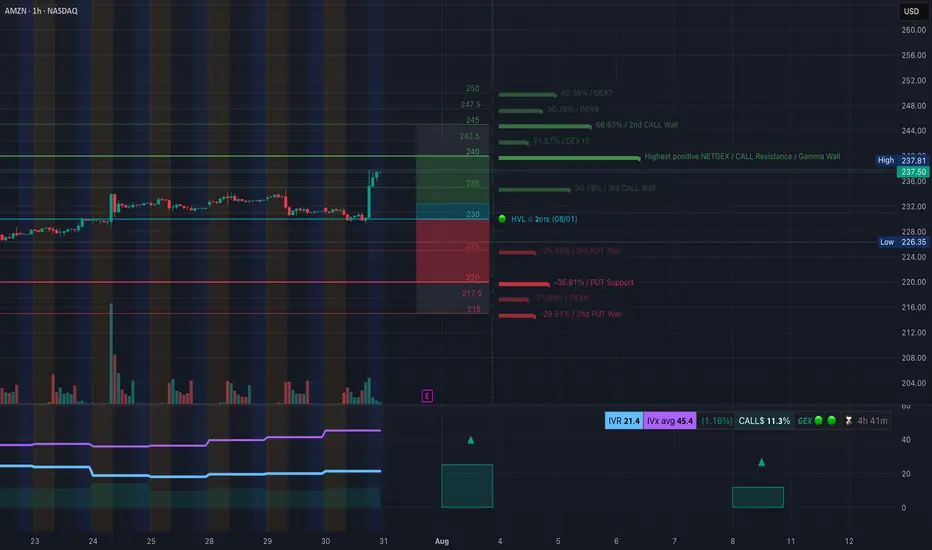
AMZN Launches Out of Trap Zone! What's next on Jul 31AMZN Launches Out of Trap Zone! Will Gamma Push Us to 245+ or Fakeout from Supply?
🔍 GEX & Options Flow Insight (1st Image Analysis)
AMZN broke out aggressively from a coil and is now trading at $237.50, right under the Gamma Wall and 2nd Call Wall. Gamma positioning shows bullish momentum potentia
See all ideas
Summarizing what the indicators are suggesting.
Oscillators
Neutral
SellBuy
Strong sellStrong buy
Strong sellSellNeutralBuyStrong buy
Oscillators
Neutral
SellBuy
Strong sellStrong buy
Strong sellSellNeutralBuyStrong buy
Summary
Neutral
SellBuy
Strong sellStrong buy
Strong sellSellNeutralBuyStrong buy
Summary
Neutral
SellBuy
Strong sellStrong buy
Strong sellSellNeutralBuyStrong buy
Summary
Neutral
SellBuy
Strong sellStrong buy
Strong sellSellNeutralBuyStrong buy
Moving Averages
Neutral
SellBuy
Strong sellStrong buy
Strong sellSellNeutralBuyStrong buy
Moving Averages
Neutral
SellBuy
Strong sellStrong buy
Strong sellSellNeutralBuyStrong buy
Displays a symbol's price movements over previous years to identify recurring trends.
Curated watchlists where AMZN is featured.


