Amazon bull flagAmazon has formed a bull flag , consolidation pattern ahead of Q4 earnings. I'm looking at a target of $255 by mid-April.
-Vince
AMZN trade ideas

Just support levels play on AMZNright now price is at support so you can get on long
right now price is at support so you can get on long
right now price is at support so you can get on long
right now price is at support so you can get on long
right now price is at support so you can get on long

BUY AMZNAMZN has created new all time high's.
Looking for retracement back to the previous resistance of $190.
The $190 level should act as support during a retracement.
The bullish trendline was established back in January of 2023. I'lll be looking at price action to determine actual entry.
My plan is to purchase shares or leaps based on price action, and if/how it pulls back to the $190 area.

A Reversal on Amazon. AMZNAlways a purely technical approach, while trading is examined. A few factors to suggest a reversal play here, and we have a double divergence on RSX momentum, diminishing volumes on the profile, apparent Elliot flat possibly in motion and a triple drive completion in position of Wave B of the flat. Inherently, reversal plays come with a higher risk nearly always, yet can be quite profitable at times. Volatility, stochastic oscillators are suggestive on the weekly chart.
We are not in the business of getting every prediction right, no one ever does and that is not the aim of the game. The Fibonacci targets are highlighted in green or purple with invalidation in red. Confirmation level, where relevant, is a pink dotted, finite line. Fibonacci goals, it is prudent to suggest, are nothing more than merely fractally evident and therefore statistically likely levels that the market will go to. Having said that, the market will always do what it wants and always has a mind of its own. Therefore, none of this is financial advice, so do your own research and rely only on your own analysis. Trading is a true one man sport. Good luck out there and stay safe.

A New Look At The 3 Step Rocket Booster StrategyWhat you will learn:
-Imagine a strategy that can help you find the best stocks to trade
-A new way to understand trend analysis
-Because its hard to hold a position you will learn the best margin level to use
To learn more watch this video
showing you what makes NASDAQ:AMZN
A good buy
But hurry and watch this video and understand this strategy
before the earnings report on 30th January 2025
Rocket boost this content to learn more.
Disclaimer:Trading is risky please learn risk management
and profit-taking strategies
And feel free to use a simulation
trading account before you trade with real money.

Amazon Inc. (AMZN): Consolidation Near Key Levels, Awaiting Bre🔥 Potential Price Targets (Next Month):
🩸 Near-term Goal: $230.00
🩸 Long-term Goal: $240.00
🔥 LucanInvestor’s Strategy:
🩸 Long: Above $223.38, targeting $230.00 and $240.00. Momentum supported by strong volume required for confirmation.
🩸 Short: Below $215.36, aiming for $210.00 and $200.00. Bearish MACD suggests downside potential if support fails.
🔥 LucanInvestor’s Commands:
🩸 Resistance: $223.38 – Breaking this level may lead to a continuation toward $230.00.
🩸 Support: $215.36 – A breakdown could pave the way for further declines.
Analysis:
Amazon is consolidating within a tight range. MACD remains neutral but hints at a potential bearish crossover. The stock is trading above its 200-day EMA ($190.96), suggesting a long-term bullish sentiment. However, failure to sustain above $223.38 could indicate a reversal. Watch for decisive moves to determine the next trend.
👑 "The market rewards those who plan ahead, not those who hesitate." — LucanInvestor

The "13 EMA" System Explained On This Price ActionThe journey of a thousand kilometres
begins with one step. Capitalism is not easy
but its possible there are
four factors of production
and capital is one of them.
The challenge is that some people
still believe in "Majic" Money
Honestly, such a thing is not real
the only thing close to that is credit
or getting money on a loan from a bank
or a hard money lender
otherwise, you will have to labour
either for free or for money
Now if you look at this chart
NASDAQ:AMZN
Notice the Bollinger bands?
I am using a 13 EMA on the Bollinger bands
when the price is below that 13 EMA it is showing
you low volatility
This is when you want to enter your
position at low volatility
This strategy is called"Dip Buying"
an idea I got from Tim Sykes.
Buying at a low volatility will
give you a chance to buy
the price at a cheap value
Before it gaps up *step #3 of the rocket booster strategy
or has a rally going upwards.
*To learn more about the rocket boost
strategy check out the references below.
You really just have to be patience
when dealing
with this kind of price movements
Rocket boost this content to learn more
Disclaimer: Trading is risky
please learn risk management
and profit-taking strategies
also feel free to use a simulation trading tool
before you
trade with real money.

Amazon I Strong Growth Projections - Next Long Opportunity Welcome back! Let me know your thoughts in the comments!
** Amazon Analysis - Listen to video!
We recommend that you keep this pair on your watchlist and enter when the entry criteria of your strategy is met.
Please support this idea with a LIKE and COMMENT if you find it useful and Click "Follow" on our profile if you'd like these trade ideas delivered straight to your email in the future.
Thanks for your continued support!Welcome back! Let me know your thoughts in the comments!

Amazon.com, Inc. (AMZN): Consolidating Near Critical Levels🔥 LucanInvestor’s Strategy:
🩸 Long: Above $223.72, targeting $230 and $235. A breakout needs volume support for sustained upside.
🩸 Short: Below $215.36, aiming for $210 and $205. A breakdown could trigger further corrections.
🔥 LucanInvestor’s Commands:
🩸 Resistance: $223.72. A breakout may ignite a rally toward $230.
🩸 Support: $215.36. A breakdown could lead to bearish momentum toward $210.
Amazon is stabilizing after a recent pullback. MACD shows waning momentum, hinting at possible volatility ahead. Traders should focus on breakouts or breakdowns from these key levels to define their strategies.
👑 "Adaptation defines success in dynamic markets." — LucanInvestor

Amazon (AMZN) - Bullish Continuation Trade Idea- AMZN is trading within a well-defined ascending channel, respecting both upper and lower trendlines.
- A recent breakout from a triangle consolidation pattern suggests potential continuation of the uptrend.
- The price is currently testing the breakout level while staying above key moving averages, reinforcing bullish sentiment.
- Moving averages (e.g., 50 EMA, 100 EMA, 200 EMA) are in an upward slope, acting as dynamic support.

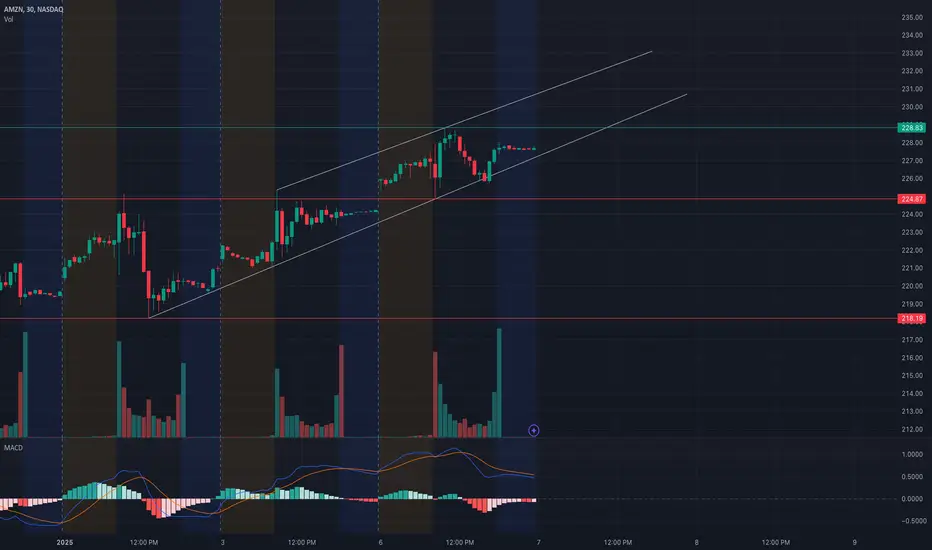
AMZN Holding a Rising Channel! Will Momentum Push It Higher?
30-Minute Timeframe Analysis
* Trend Overview: AMZN continues to trade in a rising channel with consistent higher highs and higher lows. The price is currently near $228.83, a key resistance level. The possibility of a market gap up or down at the open may change this structure significantly, requiring traders to reassess and adapt their plans accordingly.
* Key Levels:
* Support: $224.87 and $218.19 are critical areas for buyers to step in if the market gaps down.
* Resistance: $228.83 and $233.65 are immediate levels to break if bullish momentum continues or a gap up occurs.
* Indicators:
* MACD: Slightly bullish but losing momentum, signaling possible consolidation unless a gap up re-establishes strength.
* Volume: A surge in volume aligns with recent upward movement, but follow-through is needed for a sustained breakout.
1-Hour GEX (Gamma Exposure) Insights
* Key Gamma Levels:
* Positive GEX: $230 and $235 are strong call resistance levels, with $230 as the highest positive gamma wall. A gap up could lead to rapid tests of these zones.
* Negative GEX: $217.50 and $215 are key put support areas, providing protection in case of a gap down.
* Options Metrics:
* IVR: Moderate at 56.1, indicating favorable conditions for directional trades.
* Calls vs. Puts: Calls dominate at 1.8%, signaling cautious optimism among market participants.
* Actionable Gamma Zones:
* Bullish Scenario: A sustained move above $228.83 or a gap up could lead to a gamma squeeze toward $233.65 or higher.
* Bearish Scenario: A gap down below $224.87 may activate put support and drive the price toward $218.
Trade Scenarios
* Bullish Setup:
* Entry: Break and hold above $228.83, or after a gap up that sustains above $230.
* Target: $233.65 and $235.00.
* Stop-Loss: Below $226.00.
* Bearish Setup:
* Entry: Breakdown below $224.87, or after a gap down that fails to reclaim $225.
* Target: $218.19 and $215.00.
* Stop-Loss: Above $227.00.
Important Note for Traders
* Market gaps at the open can shift the outlook significantly. Reassess support and resistance levels during the pre-market session and adapt your strategy to align with the updated price action.
* If you need technical analysis for AMZN or any other stock, feel free to contact me for tailored insights and detailed analysis.
Disclaimer: This analysis is for educational purposes only and does not constitute financial advice. Please conduct your research and trade responsibly
AMZN Fib Circles Gann FanNASDAQ:AMZN
Nice trend spotted using this Gann Fan on the Fib Circles. Each time you bounced off the bottom of the purple line the stock went to new highs. Marked these points with the "Arrows"
Looking at the Fib Circles, the stock can be seen entering a new range which means new highs.
Amazon is looking good.
Comment what you think about this chart.
Comment any tips or suggestions.
NASDAQ:AMZN

Top 5 Weekly Trade Ideas #2 - AMZN Bull FlagClean looking bull flag here on AMZN. An upside break should lead to a move back up to ATH, which may also present a long opportunity if it breaks and holds on a retest. Flag pole target is up near $265.
Longer term downside target is around $195 if it turns bearish.

Amzn wk longsAmazon wk showing longs. We can use this demand for daytrades upto its departure area only. After hitting departure we will decide either we go up or down.

$AMZN sharp wedge formation on Daily!NASDAQ:AMZN forming a sharp wedge on Daily timeframe, closing above EMA 20.

AMZN Chart and TAAMZN Chart and TA:
Bull flag/pennant it has formed on the 4hr and daily.
If it breaks out of that to the upside with a strong volume candle, it should fill the gap at $226.67 then test the resistance levels overhead as it tries to push to $231.50 short term. Measured move if it can sustain the upside breakout would put it in that $235-$240 range.
If it breaks to the downside to invalidate the bullish setup, it will test that trend line and $218.16 support confluence. If that breaks, it would short term head to $214.31 to test and potentially head back to $200 if that can't hold.

Amazon: Ready to Explode in 2025! 40% UPSIDECHARTURDAY - NASDAQ:AMZN Ready to Explode in 2025!
A great fundamental and technical setup for 2025!
-Multi-year CupnHandle with successful retest and we haven't realized the measured move yet
-Green H5 indicator
-Volume shelf w/ free space
-Williams CB is thriving
Pulled back to 9ema and previous resistance to flip into support and bounced.
🎯$231🎯$280 🎯$310
Not financial advice

Amazon (AMZN) Price Action Outlook for Monday, December 6, 2025Amazon (AMZN) closed at $224.19 today, following a high of $225.36 and an open at $222.51. While the stock remains above the 21, 50, and 200 EMAs, signaling a generally bullish trend in the medium term, today’s price action suggests hesitation in the short term. Adding to this cautious outlook, the MACD shows a bearish crossover, which could confirm a potential slowdown or pullback if downward momentum continues into Monday.
Key Levels to Watch for Monday:
** Resistance at $225.36 : Today's high has established a near-term resistance level. If AMZN cannot break above this mark early in the session, it may continue to face selling pressure. A strong move and close above this level would be a positive sign for the bulls.
** Support at $222.51 (Open) : The open price from today could act as an immediate support level. A hold above this level would keep the bullish outlook intact. However, a break below could lead to a test of the 61.8% Fibonacci retracement level, which has recently acted as strong support.
** Fibonacci Levels : AMZN is struggling to close above the 38.2% Fib retracement around $228-$230, indicating resistance in this area. Breaking above this zone is crucial for resuming the bullish trend.
What to Expect:
* Bearish MACD Crossover : The MACD's bearish crossover indicates a potential shift in momentum to the downside. If this signal gains confirmation with continued price weakness on Monday, we may see a deeper retracement or sideways action.
* Bullish Scenario : If AMZN breaks above $225.36 and sustains momentum, it could push toward the next resistance levels and potentially retest $233.00, the previous high.
* Bearish or Consolidation Scenario : If AMZN fails to reclaim $225.36 and breaks below $222.51, the next move could test support near the 61.8% Fib level. A confirmed bearish MACD crossover would add weight to this scenario.
Key Indicators to Watch:
MACD Confirmation : Pay close attention to whether the MACD crossover leads to further downside momentum. This will be a crucial signal for determining the short-term trend.
RSI : The RSI remains below overbought conditions (70). A rising RSI would support bullish momentum, while a drop back toward neutral levels would indicate weakness.
Monday’s price action hinges on AMZN’s ability to reclaim $225.36 resistance and sustain momentum. The bearish MACD crossover introduces a cautionary note, suggesting a potential pullback or sideways action unless bulls regain control. A move above the 38.2% Fib retracement could confirm bullish continuation, while a failure to hold $222.51 may result in a deeper retracement.
Stay tuned for further updates as we monitor these key levels and indicators going into next week!

Break out neededGod bless you all. AMZN needs a break from the downward parallel structure, and also a bullish MACD(Chris Moody) cross over for some possible bullish price action. There is also possibly a double bottom being formed. Stochastic RSI is in oversold zone. Thank God for wisdom. Please be cautious wait for confirmation and confluences and have a safe day.

AMZN Analysis and Price Projections for 2025 Analysis and Price Projections for 2025 (3-to-5-Month Outlook)
Below is my analysis for each chart with a focus on Elliott Wave patterns, Fibonacci levels, and potential buy-the-dip opportunities.
Amazon.com Inc. (AMZN)
Current Price: $219.39
Key Levels:
Resistance: $233.00 (Wave 5 peak).
Support: $175.10 (38.2% retracement), $157.22 (50% retracement).
Outlook: AMZN has likely completed Wave 5 and is in an ABC correction. Key levels to watch are $175.10 and $157.22 as buy-the-dip zones.
Projection: A bounce from these levels could see AMZN trading back towards $200-$220 in the next 3-5 months and maybe $250.00 by year end.

Amazon.com, Inc. (AMZN): Bullish Long-Term Perspective🚨 Disclaimer: This analysis is for educational purposes only. It is not financial advice. Always do your due diligence before trading or investing.
Key Observations:
Elliott Wave Structure:
- Amazon is following a bullish Elliott Wave sequence on the weekly timeframe.
- The chart highlights the completion of a Major Wave II corrective phase and a strong impulsive Major Wave III underway.
- Amazon has recently completed Wave (I) within Cycle Wave III and is likely heading for a corrective Wave (II).
Price Action and Current Levels:
- Current Price: $219.39
- Amazon recently peaked within Wave (I) at approximately $260.
- The invalidation level is marked at $81.76, below which the current wave structure would be invalidated.
Support and Resistance Zones:
Key Support Levels:
$200 - $190: Anticipated support for Wave (II) correction.
$175 - $160: Stronger long-term support zone for any extended pullback.
Key Resistance Levels:
$260 - $270: Resistance from the prior high of Wave (I).
Beyond $300: Long-term bullish target for Wave (III).
Wave Forecast:
After the completion of Wave (I), Amazon is poised to enter a corrective Wave (II), likely taking the form of an ABC correction.
Once the correction concludes, Wave (III) is expected to initiate a strong upward rally, targeting $300 and beyond.
Trading and Investment Strategy:
For Long-Term Investors:
- The bullish macro structure remains intact.
- Consider accumulating shares during the anticipated Wave (II) pullback in the $200-$175 zone.
Earnings Reports: Amazon's profitability and growth metrics will play a key role in validating this bullish outlook.
Sector Performance: The tech sector's recovery will be pivotal in propelling Amazon higher.
Macroeconomic Conditions: Fed policy, inflation rates, and consumer demand are key factors impacting valuation.
Conclusion:
Amazon is positioned for a long-term bullish run, supported by strong fundamentals and Elliott Wave analysis. While short-term corrections are likely, the overarching trend suggests significant upside in the years ahead.
💬 What’s your take on Amazon’s future? Drop your thoughts below or ask any questions! 🚀

Short Tesla Long Amazon then swaphistory rhymes, hope you guys are ready for amazon to outperform in 2025. Nuclear Energy + Ecommerce will be a temporary winner while tesla bagholders get washed. Those like me who bought 140 knew this was a pump and dump (not straight dump, more like a wyckoff distribution till the very end when itll dump)

Short Following the stock for a secure short - once price retraces and respects upper channel wall , we can enter short upon bearish confirmation
