Amazon stocks continues to amazeAmazon continues to break to new highs, reaching almost $200.00, before pulling back a little. It was still up a good 2% at the time of writing, but it looks like more gains could be on the way after this week's bullish breakout.
On Wednesday, Amazon broke through the resistance in the $190 - $191 range, closing up 3.9% at a record high. This surge made it the fifth member of the "Magnificent 7" stocks to reach a market capitalization of $2 trillion. This breakout is a bullish signal that could sustain the tech rally even if leaders like Nvidia slow down.
The $190-$191 range has now become a crucial support zone to monitor for any short-term dips. To maintain the bullish sentiment, this area must hold.
The line in the sand is $185.33, Monday’s low. If this level is breached, it would invalidate the bullish breakout, indicating a false breakout and potentially leading to a significant sell-off.
But my base case scenario remains bullish and with the stock at record highs, it could easily rise above $200 in the days ahead.
By Fawad Razaqzada, market analyst at FOREX.com
AMZN trade ideas

AMZN inverse h&s updateI cannot tell you how many people faded this idea and stated it was not a head and shoulders. With H&S you need to predict the second shoulder before it happens, not afterwards. This trade has played out immesely as I am only in AMZN LEAP calls. I did sell covered calls against the position which will likely cause them to be called away at thousands of dollars in profit (fine with me).
-My target is still 210$

AMZN Shares Set a New All-Time HighAMZN Shares Set a New All-Time High
As shown in the AMZN chart, yesterday the share price confidently surpassed the psychological level of $190, closing above $193.41, which is a new all-time high.
Specifically:
→ the growth was approximately +3.9% for the day, with the closing candle at the upper part (a sign of strong demand);
→ Amazon's market capitalisation exceeded $2 trillion.
According to Benzinga, the rise in AMZN's price was driven by:
→ the news that BofA Securities analyst Justin Post maintained a "Buy" recommendation and raised the target price from $210 to $220, citing the potential for improved efficiency through better logistics.
→ the information that Amazon is preparing to launch a discount section similar to Temu, which will offer direct delivery from China.
Technical analysis of the AMZN daily chart shows that:
→ the price is moving within an upward channel (shown in blue), being in the upper half of it (evidence of strong demand);
→ rising lows A-B-C, which formed under the $190 resistance, reflect the essence of the cup-and-handle pattern;
→ bulls have the potential to rise to the upper boundary of the channel.
The bulls may be supported by:
→ the $190 level, which had acted as resistance since mid-April but was broken yesterday;
→ the median line of the blue channel.
According to TipRanks, the average target price for AMZN predicted by Wall Street analysts is $221.55 (an increase of 14.43% from current levels) within 12 months.
Buy and sell stocks of the world's biggest publicly-listed companies with CFDs on FXOpen’s trading platform. Open your FXOpen account now or learn more about trading share CFDs with FXOpen.
This article represents the opinion of the Companies operating under the FXOpen brand only. It is not to be construed as an offer, solicitation, or recommendation with respect to products and services provided by the Companies operating under the FXOpen brand, nor is it to be considered financial advice.

Amazon buying zone from 124 to 127From its peak in Sept 2023, it has fallen 20 bucks and is offering its loyal investors to start accumulating again. The yellow zone on the chart shows the multiple support between price level at 124 to 127 and the rally that enfolds.
I believe we are in the zone again. So, I will be awaiting for a nice pull back and start buying more of this company. They are one of the beneficiary with the upcoming year end holidays like Christmas, New Year, Halloween , etc.
Watch out for this rally!!!

Gaps unpredictable and frustrating to time it - AMZNIn Apr 22, had you waited 3 months for the gap to be filled up, your joy is short lived as it quickly plunge down more than 40% until Jan 23.
In Oct 22, the same thing happened. You went long and it quickly fell 20% until Jan 23. Very few people would have known the bottom was in Jan 2023, all these are on hindsight and then you go :"Had I known, I would have sold my house and went all in " kind of thing......
Then in May 23, look what happened. It gap up not a lot but till now, it has not been closed. So, the moral of the story is do not time the gap. It is unpredictable. Buy great businesses with solid fundamentals, strong economic moat and has proven itself years after years , like Amazon.
If for the small gap, you insisted to wait for it to fill up before going long, then you would have missed the potential 79% returns it offered you had you went long. REGRET? Then, you took revenge and bought more at the peak and it falls or crash like some of the tech stocks now and you lament about your bad luck. Such things happen every day, around the world to some people, hopefully it was all the past for us and we become wiser over time and not dabble in this prediction fantasy and ego boosting game of calling the market timing. Be in the market and let them do their job. That's all , investing is straight forward and boring but people come out with all kinds of stuff to make it complicated and confused themselves or out to make money for their own gains - thousands of indicators, thousands of online courses , videos, etc.
Wise up , guys !

Amazon ,,, BreakoutUptrend
In daily time,it was a breakout by a good bullish candle. All time high has been broken and it can be a new trend toward up. I can not consider a target for that , by getting help from Fibo it could be around 250-255 by setting SL at about 179.
Personally, I am waiting for a pullback to be sure about the breakout.
Good luck

AMZN going down-a-dozenThere is strong negative divergence on the price and has very likely done a double top at $189 area. Ideally, if that double top is confirmed in the next one or two candles, then it should fall to at least the rising trend line. However, that rising trend line also is making the bearish flag pattern. So there is high likelihood that it will loose support of trend line, which if it does, should fall to the bearish flag pattern target of ~$119, which happens to be a strong support area. This would be the best point to buy Amazon! But that's if it follows those possibilities. Now as you would expect, it would not be a linear fall, but likely a 4-6 month thing, which time wise, aligns perfectly with end of year retail sparks. So if we end at that price point around Oct, I am going heavy in to this. Alternatively, all of this is bullshit, and price gets support earlier and has a change of trend, so watch for the support areas $174, $167, $156, $145 and $126. Time will tell, but in the very short term, price should be falling to one of the support areas.

AMZN Trade IdeasThis is an interesting chart. It's been fairly strong lately and not far off ATH with the majority of other mega caps. We have this ascending channel that was temporarily broken today, but it closed back above with a big lower wick. If it gaps down below tomorrow, I'd look for short entries targeting the trendline below. That could present a good long opportunity, or it could be another short if it ends up breaking below that as well.

Amazon - Breakdown of the breakout!NASDAQ:AMZN is definitely ready for a major bullish (triangle) breakout.
Here we have a textbook example of a bullish stock. Amazon's stock chart is simply moving from bottom left to top right. Of course there are minor corrections here and there, but the trend is clearly higher. For the past four months, Amazon has been hugging a horizontal resistance level and is preparing a bullish breakout. This will certainly become a decent break and retest setup.
Levels to watch: $185
Keep your long term vision,
Philip - BasicTrading

$AMZN Amazon Hitting New All Time HighNASDAQ:AMZN Amazon Hitting New All Time High, we are long term investors in The Everything Store. Large green dot enter long position March 27, 2023

AMAZON Pair : AMZN - AMAZON
Description :
Rising Wedge as an Corrective Pattern in Long Time Frame and Short Time Frame
Break of Structure
RSI - Divergence
Completed " 12345 " Impulsive Waves
Resistance Level

AMZN longNice clean sideways movement right under the same resistance line of the last few months. Could see a return to momentum on a break above this line around 189.

AMZN updateThe inverse head and shoulders on the AMZN weekly looks to be playing out. The attack of the neckline has begun, this projects to over 210$. With QQQ weakness impending, this could still play out since Amazon as not run as hard as the other big tech recently. Otherwise it may take a few tests for this to breakout.

Amazon Will Soon See Its All Time High AgainReasons why we are bullish for Amazon:
stable fundamentals that point to constant growth
healthy macroeconomic environment with falling inflation
clear stabilization of the share price within a bullish order block with bullish price action
strong performance of the US indices, especially the NASDAQ
Amz ready to breakoutAmazon all set to breakout from its all time high resistance
Buy at breakout confirmation at 191 on daily
Very good risk to reward ratio
Dyor

the triple top debateSo even though I don't think the correction will be super low, I do see it bouncing off the 100, but that's only at the mid-180s level, like it has done in the past.

Amazon (AMZN): Preparing for a CorrectionWe need to zoom out significantly to get a clearer picture of Amazon. The stock has been in a maximal zone between $177 and $214. For the past three months, it has been ranging between $177 and $188, at the top of Wave B.
Current Situation:
Elliott Wave Analysis: We believe a substantial drop is necessary to complete the overarching Wave (2). The parallel trend channel that was broken with the completion of Wave 5 should be revisited to finalize Wave (2). This would be a textbook Elliott Wave behavior - breakout of a trend channel to complete the wave 5 as a fakeout and a deeper correction to flush some participants out of the market and into slight panic mode.
Target Range: We are targeting a range between $131 and $103 as a likely zone for this correction to end.
Ranging Behavior: Amazon has been ranging for three months, indicating consolidation before a potential move.
Strategy:
Observation Mode: We are currently observing the stock for signs of weakness.
Limit Order: A limit order will be considered if the stock begins to show significant downside momentum. If and when we decide to place a limit order, we will issue a detailed market report.
Amazon's current range suggests consolidation, but we expect a deeper correction to complete Wave (2) rather than a breakout to the upside. We are monitoring for signs of weakness and will place a limit order if conditions are met. For now, there is no immediate need to place an order. Further updates will be provided as the situation evolves.

SPY Q2 2024SPY ETF Q2 2024 view with RSI and 200, 100, 50, 20 VWMA indicators.
SPY
GOOGL
NVDA
AMZN
AAPL
MSFT
AVGO
META

Finding Confluences Increase Trade ProbabilitiesFinding confluences in securities always increases chances of a successful trade. In this example, FEMA (Custom Fragmented Exponential Moving Average) is stacked correctly, the price bounced off FEMA on the pullback, and the pullback also matched Fib 0.382 level. Expecting price to reach $190.98, as that was prior high level, and it also matched the Fibonacci 1.272 extension. Then, expecting $195.64, which is Fib 1.618 extension, and Keltner Channel upper band(upper green line) is estimating price to reach that level before reverting back to the mean.

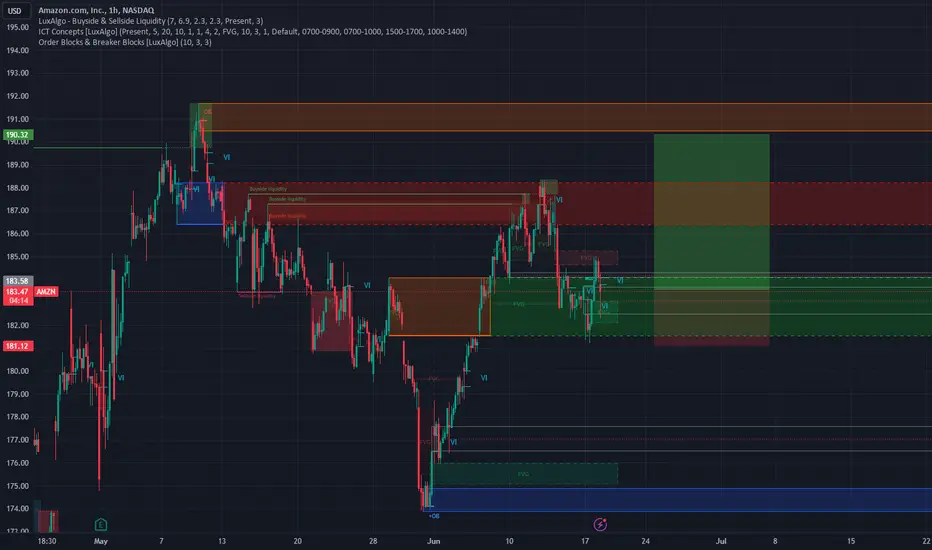
Analysis of Amazon (AMZN) Price Action: Short to Medium Term OutAnalysis of Amazon (AMZN) Price Action: Short to Medium Term Outlook
Upon examining the hourly timeline for Amazon (AMZN), it becomes evident that the stock is currently testing a significant support level that has been established since late April. This support line has proven resilient, having been touched multiple times over the past few weeks.
Technical Analysis Overview
Support Line Analysis: The repeated tests of the support line suggest that it is a robust level where buyers have consistently stepped in to prevent further declines. This indicates strong buying interest whenever the stock approaches this zone.
Bullish Signal: The bounce off this support line in the recent price action signals a potential bullish reversal in the short to medium term. This pattern often suggests that buyers are willing to enter at these levels, viewing the current price as attractive for accumulation.
Volume Confirmation: It would be prudent to confirm this potential reversal with a look at trading volumes. Ideally, an increase in volume accompanying the bounce off support would strengthen the bullish case, indicating conviction among buyers.
Resistance Levels: As the stock attempts to bounce, the next critical hurdle will be overcoming nearby resistance levels. These levels could coincide with previous highs or key moving averages, which may act as barriers in the short term.
Market Sentiment and Economic Indicators
Macro Environment: Understanding the broader market sentiment and economic indicators can provide context. Factors such as consumer spending trends, economic data releases, and sector-specific news can impact Amazon’s stock performance.
Competitive Landscape: Monitoring developments among Amazon’s competitors and within the e-commerce sector can also offer insights into future price movements.
Conclusion
In conclusion, the current technical setup on the hourly chart of Amazon (AMZN) suggests a bullish outlook in the short to medium term. The repeated testing and bounce off the strong support line since late April indicate resilience and potential accumulation by market participants. However, traders and investors should remain vigilant for any signs of reversal or failure to sustain above resistance levels. Confirmation through volume and market sentiment analysis will be crucial in validating this bullish scenario.
This analysis provides a foundation for decision-making but should be complemented with broader market analysis and risk management strategies to navigate potential volatility and market uncertainties effectively.

Updated AMZN inverse H&SHere is the weekly view of the AMZN inverse head and shoulders I finished a while ago. I added a demand zone as well. You will note a nice bounce on the 20EMA supporting this idea long-term. My short-term target is still 210$ here. A brief dip into demand and blastoff is my prediction.
-A test of 189$ is needed before the 210$, this is the area of resistance that would allow for price discovery as well
-There is not much resistance until that point

AMZN Flagging MonthlyAMZN has be prepping for a breakout for 3 months now, this prime day could be catalyst for the breakout. We might see 200 soon.

$AMZN
I believe Amazon's stock will retrace to $175 or below for several reasons. Firstly, we've touched the top of the consolidating range at $188 for the third time, suggesting strong resistance at this level. Additionally, there's a bear flag forming on the hourly chart, indicating potential downward momentum. This presents a great buying opportunity when the stock hits the $175 area. Furthermore, with Prime Day coming up next month, I anticipate it will act as a catalyst to drive the stock back up to $200.
