AMZN Heading to $210, ATH, $177.55 Entry0. Notes to follow;
1. Amazon bouncing off a rising ascending broadening breakout pattern;
2. AMZN heading to $190, then $210;
AMZN trade ideas

Even AMZN may struggle at 2021 HighsNASDAQ:AMZN rebounded off a gap up support level which implies that this is where fundamentals are likely to be. The stock's price shows resilience and no HFT interference for now, even after the Q1 earnings report after market yesterday.
Amazon has more than just its retail consumer and small business products. It has AWS with AI integrated to help the small businesses that sell via AMZN.
AMZN weekly chart shows that the highs of this month ran into the 2021 all-time highs. Note the negative divergence between the price trend and the Accumulation/Distribution indicator line, indicating a lack of buyers at that high. This resistance level is likely to take another quarter or more to overcome unless there is a big surprise. This goes for all companies, not just AMZN.


Amazon delivers results for the first quarterAmazon announced its earnings for the first quarter of 2024 yesterday after the closing bell. The company reported net sales worth $143.3 billion, marking a 13% YoY increase, and net income of $10.4 billion, up 225% YoY. Operating income rose to $15.3 billion, representing a growth of 218% YoY, with the AWS segment contributing $9.4 billion to the figure and accounting for 62% of the total operating income. In addition, the company’s operating cash flow increased by 82% to $99.1 billion for the trailing twelve months, compared with $54.3 billion for the trailing twelve months ended by 31st March 2023. These results topped the estimates, and the company’s shares slightly soared in the aftermarket.
Net sales = $143.3 billion (13% YoY) vs. $127.4 billion in 1Q23
Net income = $10.4 billion (225% YoY) vs. $3.2 billion in 1Q23
Operating income = $15.3 billion (218% YoY) vs. $4.8 billion in 1Q23
Additional information:
Amazon sales in North America rose by 12% YoY.
International sales grew 9.6% YoY.
Sales within the AWS segment increased by 17% YoY.
Sales within Amazon’s advertisement unit grew by 24% YoY.
Forward guidance
Net sales for the second quarter of 2024 are expected to fall between $144 billion and $149 billion, representing a growth between 7% and 11% compared with the second quarter of 2023. Operating income is expected to be between $10 billion and $14 billion, compared with $7.7 billion in the second quarter of 2023.
Please feel free to express your ideas and thoughts in the comment section.
DISCLAIMER: This analysis is not intended to encourage any buying or selling of any particular securities. Furthermore, it should not be a basis for taking any trade action by an individual investor or any other entity. Therefore, your own due diligence is highly advised before entering a trade.

AMAZON :SUPERMILLENNIUMAmazon is observed to fall after the formation of a whipsaw.
Amazon shareholders should be careful.
There will be major events such as the FOMC meeting soon, so there is nothing to be sorry about.

Amazon Surges on Earnings Beat Despite Cloud Growth ConcernsIn a whirlwind of earnings reports, Amazon.com ( NASDAQ:AMZN ) managed to dazzle investors with a stellar performance in the first quarter, even as concerns linger over its cloud-computing growth trajectory.
The e-commerce giant reported a 13% surge in first-quarter sales, reaching $143.3 billion, surpassing Wall Street's expectations. Bolstered by strong demand across its various segments, Amazon ( NASDAQ:AMZN ) saw its shares climb as much as 6% in after-hours trading, though settling at a 3% gain following a 3.3% decline in the regular session.
However, Amazon's second-quarter revenue forecast fell below analyst expectations, signaling caution amid anticipations of subdued spending on cloud-computing services by cost-conscious businesses. Despite Amazon Web Services (AWS) posting a commendable 17% rise in revenue to $25.0 billion, concerns linger over its growth rate compared to competitors like Microsoft and Alphabet.
CEO Andy Jassy remains optimistic, citing a resurgence in companies' infrastructure modernization efforts and the appeal of AWS's AI capabilities, propelling AWS's growth rate forward. Jassy boldly predicts AWS's trajectory toward achieving $100 billion in annual sales, underscoring the company's commitment to innovation and market leadership.
Amazon's first-quarter net income more than tripled to $10.4 billion, significantly surpassing analysts' expectations and reflecting the company's ability to capitalize on shifting consumer behaviors and economic trends. However, despite this impressive performance, Amazon diverges from its Big Tech peers by bucking the trend of announcing a dividend, a move celebrated by investors in rival companies like Alphabet and Meta Platforms.
The decision to forgo a dividend announcement underscores Amazon's focus on reinvestment and future growth opportunities, with CEO Andy Jassy prioritizing innovation and expansion over short-term investor gratification. As one of the few tech giants not offering dividends, Amazon continues to chart its course by maintaining a steadfast commitment to its long-term vision.
Despite challenges and fluctuations in employment figures, Amazon ( NASDAQ:AMZN ) remains a powerhouse, with 1.52 million employees and a resilient stock performance, outpacing the broader market in 2024. While uncertainties loom, Amazon's relentless pursuit of innovation and market dominance positions it as a force to be reckoned with in the ever-evolving landscape of e-commerce and technology.
As the company navigates the complexities of the global economy and competitive pressures, Amazon's resilience and adaptability continue to inspire confidence among investors and analysts alike, cementing its status as a cornerstone of the modern digital economy.

Sharing AMZN chart from the TTR We are short as of high of the Sharing AMZN chart from the TTR
We are short as of high of the day
AMZN reports after the close
The price has re-tested the broken ending diagonal channel from below, a bearish signal by itself.
I will take one lotto put. Implied volatility for AMZN stock is about 8% in either direction

Great Expectations: Amazon Q1 EarningsAs Amazon gears up to announce its first-quarter earnings for 2024 after today’s closing bell (April 30th), traders are poised to capitalise on the potential volatility and opportunities that this news event may bring to the market.
Let's delve deeper into what investors can expect from Amazon's Q1 earnings by examining market expectations, growth drivers, and key levels to keep an eye on.
Anticipated Financial Performance
Analysts are currently forecasting that Amazon's first-quarter revenues will reach approximately $142.53 billion, reflecting a slight decrease from the previous quarter's revenue of $170 billion. This anticipated decline is partly attributed to seasonal factors and potential challenges in consumer spending amid global economic headwinds.
However, despite the expected dip in revenue, analysts remain optimistic about Amazon's profitability. The consensus estimate for Amazon's diluted earnings per share (EPS) in Q1 2024 stands at $0.83, indicating a slight decrease from the previous quarter's EPS of $1.00. Despite this decrease, Amazon is poised to maintain its strong profitability, driven by efficient cost management and continued growth in high-margin segments such as Amazon Web Services (AWS) and advertising.
Key Growth Drivers
Several factors are expected to drive Amazon's performance in Q1 2024:
E-commerce Momentum : Despite potential headwinds from supply chain disruptions and inflationary pressures, Amazon's core e-commerce business is anticipated to continue benefiting from the ongoing shift toward online shopping. Analysts project that Amazon's gross merchandise volume (GMV) will remain robust, supported by strong demand for a wide range of products and services offered on its platform.
Amazon Web Services (AWS) : As a leading player in the cloud computing market, AWS is expected to maintain its growth trajectory in Q1 2024. Analysts anticipate that AWS revenues will continue to grow, driven by increased adoption of cloud services by enterprises and the expansion of AWS's global footprint.
Advertising Revenue : Amazon's advertising business is forecasted to experience strong growth in Q1 2024, fuelled by the growing adoption of its advertising solutions by brands and sellers on its platform. Analysts expect that advertising revenues will surpass $10 billion for the quarter, reflecting a significant increase from the previous year.
AI : Amazon's ongoing investments in innovation and technology, including AI and machine learning, are expected to drive future growth. The company's focus on enhancing customer experience through initiatives such as custom generative AI chips is anticipated to strengthen its competitive position and drive long-term value for shareholders.
CEO Commentary and Strategic Outlook
Investors will closely monitor CEO Andy Jassy's commentary on Amazon's strategic priorities and outlook for the future. Jassy's insights into Amazon's expansion plans, investments in infrastructure and technology, and efforts to drive innovation will provide valuable insights into the company's long-term growth prospects and positioning in the competitive landscape.
Key Levels: Bullish Reversal Pattern Emerges Ahead of Earnings
Amazon's share price has surged more than 20% year-to-date, underscoring the market's bullish sentiment and high expectations heading into the upcoming earnings report.
Recent price action has delineated several key levels that traders should monitor closely leading up to the Q1 earnings release:
Bullish Abandoned Baby Variation: Last week, Amazon's price action formed a variation of the bullish abandoned baby candle pattern. This pattern occurs when the shares gap lower but subsequently gap higher in the following session, creating an abandoned candle. While the abandoned candle in this variation is larger than usual, its significance remains noteworthy. The lows of the abandoned candle serve as significant support levels, providing key reference points for traders post-earnings.
Monday's High: During Monday's trading session, Amazon's shares experienced a gap higher, followed by a close at the top end of Friday's range. This development establishes a minor inflection point for traders to monitor, signalling potential bullish momentum leading into the earnings announcement.
April High: The highs achieved in April represent a crucial resistance level that may come into play should Amazon's share price test these levels post-earnings. Traders should be attentive to any price action around this level, as a breakout could signal further bullish momentum, while a rejection may indicate potential consolidation or a reversal.
AMZN Daily Candle Chart
Past performance is not a reliable indicator of future results
Disclaimer: This is for information and learning purposes only. The information provided does not constitute investment advice nor take into account the individual financial circumstances or objectives of any investor. Any information that may be provided relating to past performance is not a reliable indicator of future results or performance. Social media channels are not relevant for UK residents.
Spread bets and CFDs are complex instruments and come with a high risk of losing money rapidly due to leverage. 84.01% of retail investor accounts lose money when trading spread bets and CFDs with this provider. You should consider whether you understand how spread bets and CFDs work and whether you can afford to take the high risk of losing your money.

AMAZON 189 AFTER OR BEFORE EARNINGS ?Reasons Why !!
Key Financial Insights:
Stock Price: Amazon’s stock reached a peak of $189.77 on April 11, 2024, showcasing a remarkable uptrend1.
Market Performance: The company’s strong market performance is evident as the stock price hovers close to its 52-week high.
Behind the Surge:
Amazon continues to dominate the e-commerce space with innovative strategies and a customer-centric approach.
The company’s expansion into new markets and consistent investment in technology and infrastructure contribute to its financial health.
Investor Confidence:
The rise to $189 signifies a vote of confidence from investors who are optimistic about Amazon’s direction and leadership.
Analysts remain bullish on the stock, with projections of further growth and a positive outlook for the company’s profitability

Amazon.com, Inc. (AMZN) - Technical Analysis PublicationMarket Sentiment and News:
AMZN has recently made headlines with a record number of same-day and next-day deliveries, an operational milestone that may reflect positively in investor sentiment. With the earnings report slated for tomorrow, the market's focus is honed in on Amazon’s financial health and future guidance.
Price Action Analysis:
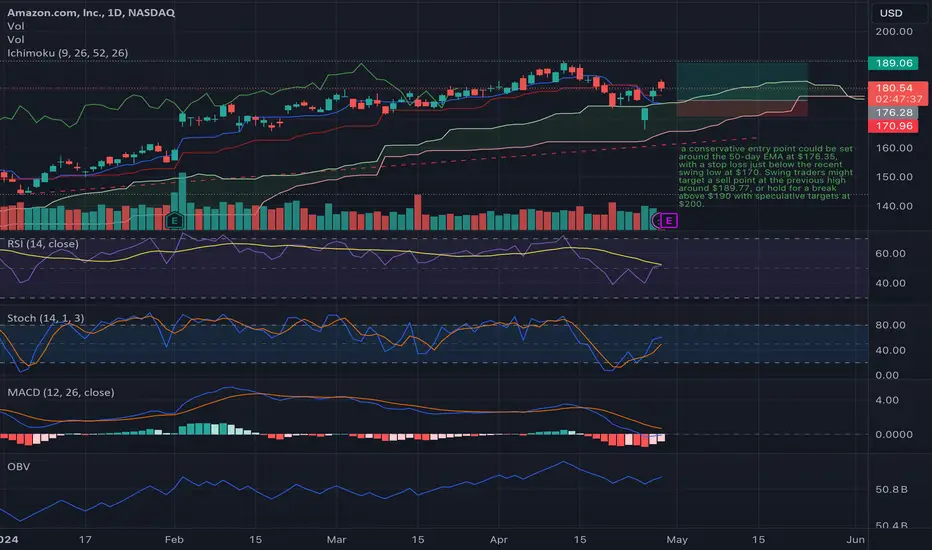
Over the recent trading period, AMZN has displayed a pattern of higher highs and higher lows, which is the hallmark of a bullish trend. The recent pullback has found support above the Ichimoku Cloud, indicating underlying bullish sentiment.
Ichimoku Cloud:
The price has rebounded off the Ichimoku Cloud, affirming the Cloud as a dynamic support level. The conversion line (blue) remains above the baseline (red), which supports the continuation of the uptrend. However, traders should monitor the cloud for any signs of a color change which may indicate weakening momentum.
Fibonacci Retracement:
The price found support near the 0.382 retracement level at $172.30, presenting a potential buying opportunity for swing traders. The bullish target is set at the previous high of $189.77, with a speculative extension towards the $200 psychological level.
Bollinger Bands:
The recent price candle has bounced off the lower Bollinger Band, suggesting a potential reversal from the oversold condition. The middle band, currently at $181.46, could act as the immediate resistance level.
Moving Averages:
The exponential moving averages (EMAs) for the 20, 50, 100, and 200-day periods are trending upward, with the price recently testing the 50-day EMA as support. A sustained price above the 50-day EMA ($176.35) is crucial for the continuation of the uptrend.
Pivot Points:
Pivot point analysis suggests that the stock is currently facing resistance at the R1 pivot level ($184.11). A decisive breakout above this point could propel the price towards the R2 level at $188.08.
Technical Indicators:
RSI (Relative Strength Index): The RSI has recovered from near the oversold region and is currently below the overbought threshold, providing room for upward price movement.
Stochastic Oscillator: The Stochastic lines have crossed upwards out of the oversold region, which could indicate the beginning of a bullish momentum.
MACD (Moving Average Convergence Divergence): The MACD line is below the signal line but appears to be converging, hinting at a potential bullish crossover in the near future.
OBV (On-Balance Volume): The OBV shows a slight upward trend, suggesting accumulation, a positive sign for bulls.
Price Prediction and Trading Strategy:
For traders, a conservative entry point could be set around the 50-day EMA at $176.35, with a stop loss just below the recent swing low at $170. Swing traders might target a sell point at the previous high around $189.77, or hold for a break above $190 with speculative targets at $200.
Conversely, should the price breach below the recent swing low of $170, it may indicate a deeper correction or reversal, thus serving as a signal to exit long positions.
Conclusion:
As AMZN approaches its earnings report, the market could witness increased volatility. Technical indicators and price action suggest a bullish outlook, but traders should remain vigilant and prepared to adjust positions based on post-earnings market sentiment and price reactions. Risk management remains paramount, given the unpredictability of market movements around earnings releases.
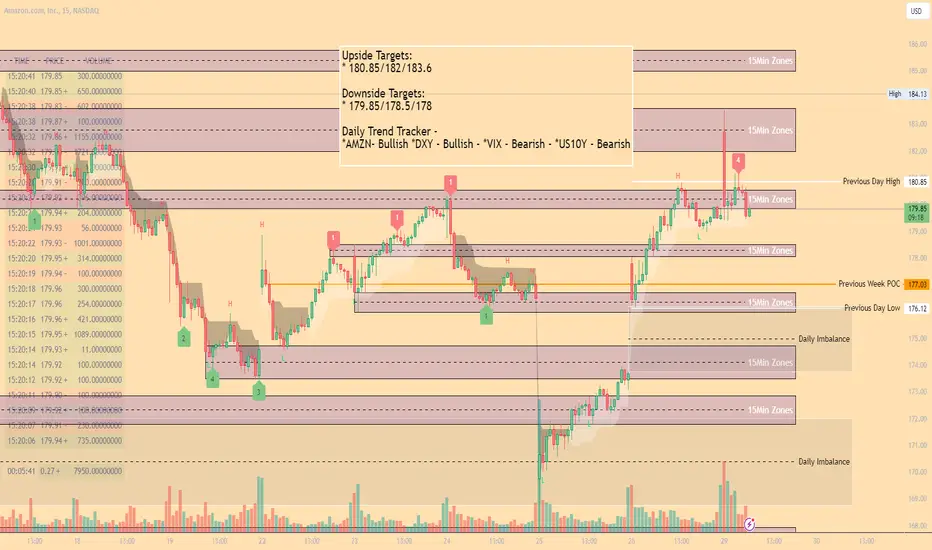
AMZN Mid Day Scalping Zones 4/29Upside Targets:
* 180.85/182/183.6
Downside Targets:
* 179.85/178.5/178
Daily Trend Tracker -
*AMZN- Bullish *DXY - Bullish - *VIX - Bearish - *US10Y - Bearish
What Are Cyclical Stocks?What Are Cyclical Stocks?
Cyclical stocks are well known for ebbing and flowing with the rhythm of the economy. These stocks, a reflection of economic trends, demand a keen understanding of how various sectors react to changing economic conditions. This article delves into the world of cyclical stocks, offering insights into their nature, impact, and strategies for navigating their unique challenges and opportunities in the financial markets.
What Is a Cyclical Stock?
The cyclical stocks definition refers to shares of companies whose performance closely aligns with the economic cycle. They thrive as the economy booms but often underperform in recessions.
Unlike counter-cyclical stocks, which tend to be stable or even prosper during economic downturns, cyclical stocks mirror the highs and lows of the economy. Industries like travel, automotive, and luxury goods are typical examples where price performance is directly tied to consumer spending and the health of the economy.
Characteristics of Cyclical Stocks
Cyclical stocks are distinguished by a set of defining characteristics. Primarily, they exhibit high volatility in response to economic changes. When the economy is growing, they often see significant gains as consumer confidence and spending increase. Conversely, during economic downturns, they often experience steep declines.
The revenues and profits of these companies are closely tied to economic activities. For instance, in a booming economy, the automotive sector might see increased sales, boosting the value of car manufacturers. Sector-specific sensitivity is a critical aspect of cyclical stocks, meaning investors and traders must be adept at interpreting economic indicators to analyse performance trends.
Another key feature is their correlation with consumer behaviour. Cyclical growth stocks typically see fluctuating demand based on consumer confidence and disposable income, directly impacting the values of companies in these industries.
Cyclical Stocks Examples
Cyclical stocks encompass a variety of industries that are highly sensitive to the economic cycle.
Automotive: Companies like Ford and Toyota. Sales in the automotive sector often rise with economic growth, as consumers are more likely to purchase vehicles.
Consumer Discretionary: Retail giants such as Amazon and Nike. These securities depend on consumer spending, which fluctuates with economic conditions.
Travel and Leisure: Airlines like Delta and hotel chains such as Marriott. Travel spending is typically high during economic booms and drops during recessions.
Construction and Housing: Homebuilders like D.R. Horton and Lowe's. Housing market growth is directly linked to the economy, influencing construction activity and home improvement spending.
Luxury Goods: Brands like Louis Vuitton and Rolex. Luxury purchases increase with rising consumer wealth in strong economies.
Economic Indicators and Cyclical Stocks
Economic indicators play a pivotal role in the performance of cyclical stocks. Key indicators such as Gross Domestic Product (GDP), employment rates, and consumer confidence indices offer insights into the health of the economy, which in turn influences these stocks.
For example, a rise in GDP often signals growth, leading to increased consumer spending and higher corporate earnings, positively impacting this class of stocks. Similarly, low unemployment rates boost consumer confidence and spending power.
Conversely, negative data may lead to declines in these stocks. During recessions, when GDP contracts and unemployment rises, cyclical sectors like travel and automotive often experience reduced demand, resulting in lower prices.
Risks and Rewards
Although when trading share CFDs, traders can take advantage of both rise and fall in the price of an asset, it’s important to be aware of the risks and rewards of cyclical stocks:
Risks
Economic Sensitivity: This stock type is vulnerable to economic conditions, leading to potentially greater risks due to the constantly changing environment.
Timing Challenges: Predicting the peaks and troughs of economic cycles is difficult. Misjudging the timing might lead to losses.
Volatility: They can experience sharp price fluctuations, adding to risks. Want to observe just how volatile these assets can be? Check them on FXOpen’s free TickTrader platform.
Rewards
High Growth Potential: During economic expansions, cyclical stocks may offer market-beating growth as consumer spending and corporate earnings increase.
Market Opportunities: Savvy investors and traders may take advantage of the predictable patterns of economic cycles.
Diversification: Including cyclical stocks in a portfolio can provide balance, as they often move opposite to defensive, counter-cyclical stocks.
Strategies for Trading Cyclical Stocks
In navigating the cyclical stock market, traders often employ several strategies:
Searching for Undervalued Stocks During Recessions: It's common to look for undervalued cyclical shares at the end of recessions. Such a period often presents opportunities for buying at lower prices, anticipating a rebound as the economy recovers.
Monitoring Economic Trends: Traders typically keep a close eye on indicators like interest rates and consumer spending. Recognising changing trends early may help in making informed decisions about when to buy or sell stocks.
Diversification: Traders often diversify their portfolios by including a mix of cyclical and non-cyclical shares. This strategy may help mitigate risk, providing protection against economic fluctuations.
Moving Into Defensive Stocks as the Economy Falters: As signs of downturn appear, traders may shift towards more defensive stocks, which are less affected by economic cycles.
The Bottom Line
These stocks, mirroring the economic cycle's highs and lows, offer unique opportunities but also pose specific challenges. By combining strategies such as monitoring economic trends, diversifying portfolios, and adopting a long-term view, traders may leverage the potential of cyclical stocks. For those seeking to delve deeper into this dynamic aspect of trading, opening an FXOpen account could be a valuable step towards engaging with the cyclical stock market. Happy trading!
This article represents the opinion of the Companies operating under the FXOpen brand only. It is not to be construed as an offer, solicitation, or recommendation with respect to products and services provided by the Companies operating under the FXOpen brand, nor is it to be considered financial advice.

Amazon Up side down tick chartupsidedown chart on amazon shows an HS with the right shoulder just retrced at 0.618 with extension on possible new all time hight

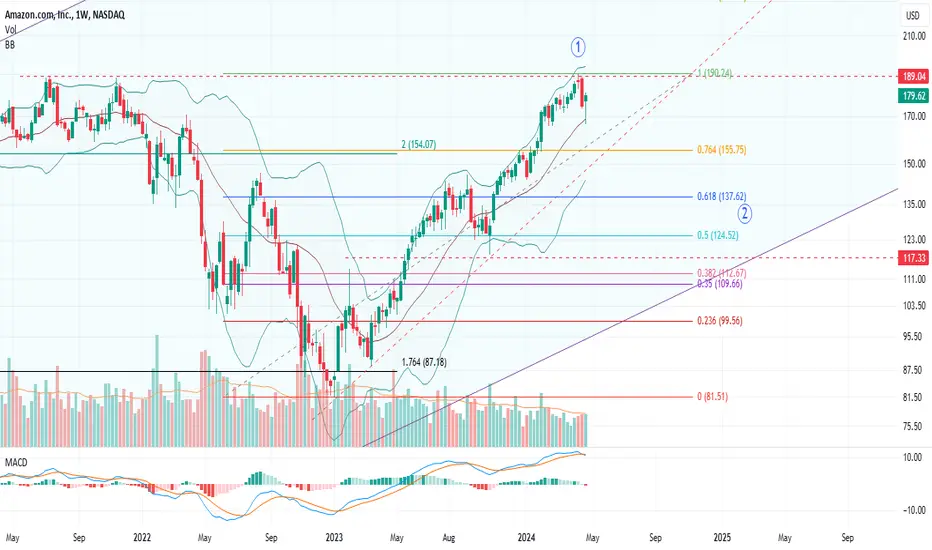
AMZN: Is wave 2 correction under way or another high first?Last week's candle seemed like the Amazon ride might be over for good. This week bulls attempt a heroic reversal. Test on weekly 20 EMA/ mid Bollinger band and getting support there is kind of a big deal. However, there is a MACD bearish cross on the weekly, along with resistance right on the mid Bollinger band on the daily time frame (not on this chart, but it is there). On lower time frame it looks like a 3 wave correction has completed last week, but it looks disproportionately small for being a primary degree correction. So my thesis for now is, either this is intermediate degree wave 4 correction and there will be one more high (and an all time high) incoming, or this is an A wave of some degree and it will be slow downward movement from here. For wave 2 correction, there are several support area targets. First on the market structure at 0.618 fib retrace at around $137 then somewhere between 0.5 and 0.38 fib retrace area $124- $112. On the upside, if we do see another high, the target would be somewhere between $214- $234 (other fib levels from various swings). Right now, waiting to see the current range ($190 - $165) to break before placing my bets...
AMAZON Under the 1D MA50 after 6 months. Is the bleeding over?Amazon (AMZN) has broken and closed below its 1D MA50 (blue trend-line) for the first time in 6 months (since October 27 2023). Last time this happened, the stock had already begun the 2nd Bearish Leg (-18.83% decline) of the 2-year Channel Up.
As a result, there's a real possibility for the stock to reach as low as the 0.382 Fiboancci retracement level and the 1D MA200 (orange trend-line) to form a new Higher Low near the bottom of the Channel Up and then rebound.
As long as the Channel Down of the Bearish Leg is intact and Amazon doesn't close a 1D candle above the 1D MA50, we will wait for a more comfortable buy at $160.00 and we will target $200.00 (+31.87% symmetrical rise as Dec 20 2023).
-------------------------------------------------------------------------------
** Please LIKE 👍, FOLLOW ✅, SHARE 🙌 and COMMENT ✍ if you enjoy this idea! Also share your ideas and charts in the comments section below! This is best way to keep it relevant, support us, keep the content here free and allow the idea to reach as many people as possible. **
-------------------------------------------------------------------------------
💸💸💸💸💸💸
👇 👇 👇 👇 👇 👇

where is the support zone?After a nice move up amazon came to the resistance line.
Where can we see support here?

Amazon looking bearish and forming a bear flag 🐻 🚩Amazon looking bearish and forming a bear flag 🐻 🚩
After its breakdown ⤵️, now with the bear flag 🚩formation shorting it is a high probability winning strategy 🧭
Mapped out our price targets and predicted price movement
👇

AMZNAmazon's earnings are coming out today after the bell. With consumer spending on the decline and key supports at $171, $165, and $161 potentially filling the February 24th gap, the stock faces crucial thresholds. A positive earnings report could propel the stock upward to around $185.

✅AMAZON BEARISH SETUP|SHORT🔥
✅AMAZON broke out of
The rising narrowing wedge
And the price is now going
Up in a rebound to retest
The broken levels above
But I am locally bearish
Biased and I will be
Expecting a further
Move down
SHORT🔥
✅Like and subscribe to never miss a new idea!✅

Amazon (Amzn) sold the $188 level. Here's what next...Hello Traders, Skyboxpips here!
Amazon stock did a sell off from the $188 level last week to the $173 price level closing out the previous weekly candle bearish.
Amazon is doing a retracement for the retest
It feels satisfying when predictions play out.

Amazon further correction pendingAmazon is continuing the uptrend within the channel. It is in correction mode and which is required to continue the uptrend.

Amazon Amazon was trading Bearish for the whole of 2022 into January this year and now we finally turned Bullish on May 15 with a Break in Structure at $113. Our main focus was the Propulsion Block resting at $126 and at the same level we had a Search and Destroy Profile sweeping 143.98 (High) and 126.33 (Low) Our first target is $159 and we looking to make a re entry around the same level. More updates to follow

$AMZN Bearish crab patternSo its not just NASDAQ:MSFT who's in bearish crab reversal zone but also NASDAQ:AMZN
