AVGO: POTENTIAL 11% SWING TRADEAVGO :
I like the setup here with a well-defined risk .
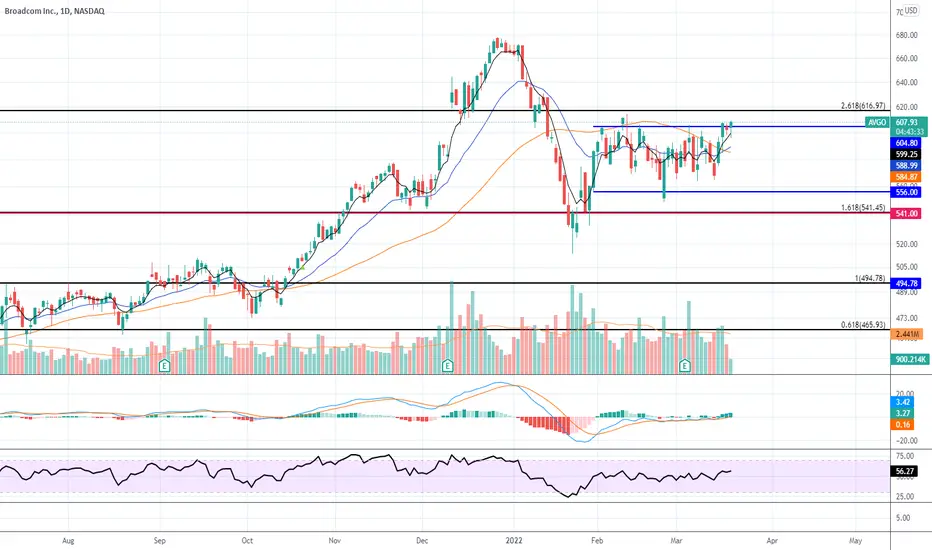
Nice sort of ascending triangle that started forming in January.
Strong support of the ichimoku cloud at 596.
Can we break 610.40 and push to the previous high at 678 in the next few weeks?
No one knows. But the risk vs reward ratio is good, as you can set your stop for a 3% max loss (below 596) and your profit target to 678 (11% profit).
Swing trade for me.
Trade safe!
AVGO trade ideas

AVGOIf the market can hold this rally and AVGO can hold above $605, it could make a run back to ath pretty quickly imo.
AVGO exposure to ChinaThe U.S. warning China it could face devastating sanctions if it defies the ban on doing business with Russia!
This is a move that could have huge impact on American companies.
35% of AVGO Broadcom revenue comes from China.
My price targets from AVGO are $460 and $422.
Looking forward to read your opinion about this.

Broadcom Stands Tall as Other Chips StruggleMost semiconductors have lagged recently as technology stocks and the broader Nasdaq-100 struggle. That makes the price action in Broadcom especially interesting.
Notice how AVGO is holding its 100-day simple moving average (SMA). In contrast, the Philadelphia Semiconductor index is mired below its 200-day SMA. (See below.)
Second, Bollinger Band Width has shrunk back to the lower end of its range. That may indicate that prices are getting ready to expand again.
Next, AVGO’s higher lows since late January are starting to form a potentially bullish ascending triangle. Notice how the 50-day SMA potentially marks the top of the pattern.
Finally, MACD has been turning positive over the course of the last month.
TradeStation is a pioneer in the trading industry, providing access to stocks, options, futures and cryptocurrencies. See our Overview for more.
Important Information
TradingView is not affiliated with TradeStation Securities Inc. or its affiliates. TradeStation Securities, Inc., TradeStation Crypto, Inc., and TradeStation Technologies, Inc. are each wholly owned subsidiaries of TradeStation Group, Inc., all operating, and providing products and services, under the TradeStation brand and trademark. When applying for, or purchasing, accounts, subscriptions, products and services, it is important that you know which company you will be dealing with. Please click here for further important information explaining what this means.
This content is for informational and educational purposes only. This is not a recommendation regarding any investment or investment strategy. Any opinions expressed herein are those of the author and do not represent the views or opinions of TradeStation or any of its affiliates.
Investing involves risks. Past performance, whether actual or indicated by historical tests of strategies, is no guarantee of future performance or success. There is a possibility that you may sustain a loss equal to or greater than your entire investment regardless of which asset class you trade (equities, options, futures, or digital assets); therefore, you should not invest or risk money that you cannot afford to lose. Before trading any asset class, first read the relevant risk disclosure statements on the Important Documents page, found here: www.tradestation.com .

This is where $AVGO finishes ERI think $AVGO falls post earnings report. Good or bad, it falls to $500+


$AVGO -Charts to keep you up at night.AVGO and so many charts are just massive negative looking situations. It all could be nothing but it markets are positioning for these companies to head severely south. Why not pay attention?!?!

Broadcom Inc broadly dropping South. AVGOImmediate targets 516, 470. Invalidation 778.
We are not in the business of getting every prediction right, no one ever does and that is not the aim of the game. The Fibonacci targets are highlighted in purple with invalidation in red. Fibonacci goals, it is prudent to suggest, are nothing more than mere fractally evident and therefore statistically likely levels that the market will go to. Having said that, the market will always do what it wants and always has a mind of its own. Therefore, none of this is financial advice, so do your own research and rely only on your own analysis. Trading is a true one man sport. Good luck out there and stay safe

Is Broadcom Seriously Oversold?Broadcom steadily advanced since the beginning of the fourth quarter, and now it’s had a dramatic pullback as sellers shred the Nasdaq.
The first pattern on today’s chart is the level around $544. It was a low on November 26 and again on December 2. Traders may look for it to provide support again.
Next, AVGO is oversold by at least two measures. Stochastics dipped even lower than their bleakest readings of 2020. Our Distance from MA script also shows price under the 50-day simple moving average (SMA) by 9 percent. It's the furthest since April 2020.
Speaking of SMAs, the chip maker is back below its 100-day SMA. The last time it touched that level marked the beginning of a sharp rally.
TradeStation is a pioneer in the trading industry, providing access to stocks, options, futures and cryptocurrencies. See our Overview for more.
Important Information
TradingView is not affiliated with TradeStation Securities Inc. or its affiliates. TradeStation Securities, Inc., TradeStation Crypto, Inc., and TradeStation Technologies, Inc. are each wholly owned subsidiaries of TradeStation Group, Inc., all operating, and providing products and services, under the TradeStation brand and trademark. When applying for, or purchasing, accounts, subscriptions, products and services, it is important that you know which company you will be dealing with. Please click here for further important information explaining what this means.
This content is for informational and educational purposes only. This is not a recommendation regarding any investment or investment strategy. Any opinions expressed herein are those of the author and do not represent the views or opinions of TradeStation or any of its affiliates.
Investing involves risks. Past performance, whether actual or indicated by historical tests of strategies, is no guarantee of future performance or success. There is a possibility that you may sustain a loss equal to or greater than your entire investment regardless of which asset class you trade (equities, options, futures, or digital assets); therefore, you should not invest or risk money that you cannot afford to lose. Before trading any asset class, first read the relevant risk disclosure statements on the Important Documents page, found here: www.tradestation.com .

Broadcom Inc is About to Dive. AVGOA very similar picture to Pfeizer from earlier today. Divergent end of a five Wave move and we won't reiterate further than this.
We are not in the business of getting every prediction right, no one ever does and that is not the aim of the game. The Fibonacci targets are highlighted in purple with invalidation in red. Fibonacci goals, it is prudent to suggest, are nothing more than mere fractally evident and therefore statistically likely levels that the market will go to. Having said that, the market will always do what it wants and always has a mind of its own. Therefore, none of this is financial advice, so do your own research and rely only on your own analysis. Trading is a true one man sport. Good luck out there and stay safe!

AVGO | Bearish trend started. Go Short!When it comes to AVGO , the price is likely to fall because of the weak support areas. Also the price has broken the parallel channel; that means the price’ll fall until it find a support area.So your first target would be the S1; where price got rejected because of the huge demand.
If you find this technical analysis useful, please like & share our ideas with the community.
What do you think is more likely to happen? Please share your thoughts in comment section. And also give a thumbs up if you find this idea helpful. Any feedback & suggestions would help in further improving the analysis.
Good Luck!
Disclaimer!
This post does not provide financial advice. It is for educational purposes only! You can use the information from the post to make your own trading plan for the market. But you must do your own research and use it as the priority. Trading is risky, and it is not suitable for everyone. Only you can be responsible for your trading.


Downswing expected in AVGO, watch out!Hey everyone! Hope you had a wonderful christmas and wishing you all the best for 2022. Today I also wanted to take a look at AVGO. I’ll keep this one short for you. Personally I would hold off on investing in AVGO since the chart looks quite risky right now. As you can see the price is trading far from its downtrend line and getting close to the upper resistance level of the uptrend channel (although this uptrend line has only been touched once so the uptrend line has not been strongly confirmed). Furthermore RSI is also giving overbought signals, with weekly RSI going as high as 80. A short-term downswing can be expected to take place pretty soon. If you made it this far I’d like to sincerely thank you for reading this and hope you have a wonderful day. Any feedback (whether positive or negative) or likes are of course really appreciated. Have a good one ✌️!

AVGO Personal Analysis AVGO has made some interesting movements.
Graph: Price has expericned a steady incline rally since passing the $510 price level. It is now trading at $574.66, after achieving its all time high of $576.73
Trends:
- Emergence of an Ascending Channel beginning on November 3rd.
- Three touches on the lower channel solidifies the validity of the channel. Two touches on the upper channel - 2nd touch currently occuring (highlighted in green circles).
MACD and RSI 1Day Timeframe:
- MACD 1D: Poised for a bearish crossover after a successful bullish movement.
- RSI 1D: Overbought - but this stock does not seem to be very responsive to RSI, and therefore will not serve as much of a significant influence.
This is not trading advice or recommendation. For viewing purpose only
Always do your own Due Diligence

$AVGO with a Bullish outlook following its earnings #Stocks The PEAD projected a Bullish outlook for $AVGO after a Positive Under reaction following its earnings release placing the stock in drift A with an expected accuracy of 85.71%.
If you would like to see the Drift for another stock please message us. Also click on the Like Button if this was useful and follow us or join us.

#AVGO - PUT Opportunity#AVGO is at all time highs recently gapping up however if you pulled the FLOW on Unusual Whales yesterday the 13th you quickly saw that the FLOW was 73% bearish with extremely large PUTS and Sold Calls being placed against AVGO for this friday's experation played the $600 PUT and already mid way through the day am up 170%


AVGOSo with great earnings, history repeats it self. Based on the support and resistances we should see some healthy retracing. I am opening a put debit spread with a 620 price target. 625/620 put debit spread. Make sure to have adequate time.

12/5/21 AVGOBroadcom Inc. ( NASDAQ:AVGO )
Sector: Electronic Technology (Semiconductors)
Current Price: $558.12
Breakout price: $567.50
Buy Zone (Top/Bottom Range): $555.60-$544.00
Price Target: $614.00-$622.00
Estimated Duration to Target: 55-60d
Contract of Interest: $AVGO 1/21/22 560c
Trade price as of publish date: $22.25/contract


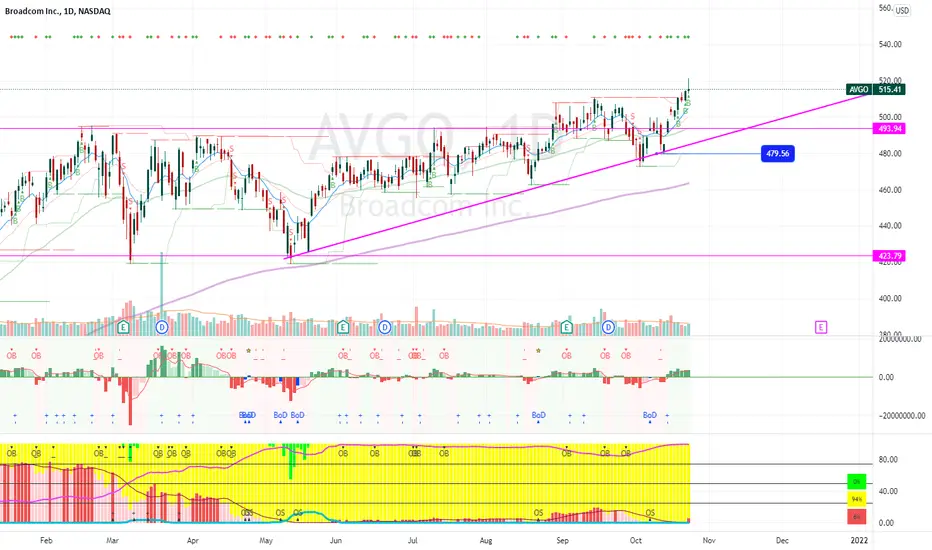
Avgo - Continue to rally ?Managed to climb and stay above 500 pychological level after moving sideway between 420 to 500 for most of 2021.
Nice and strong uptrend with EMA20 to EMA200 line up.
FiFT +ve indicating strong bull.
Weekly Chart MCDX 75% but daily chart MCDX banker still low with only 6%.
Fibo target 570. Support 480
Based on Finviz, Avgo gross margin is 60%, RoE 24%. Analyst's target price 551
Plan :- Monitor and wait for price pullback to near EMA50. Valid only if price stay above trendline.

A Review of AVGOWas asked to take a look at AVGO. In an interest to continue learning and stretching myself I thought I would take it on. Here’s where I landed.
The stock spiked hard starting 25 October and gained nearly 17% in 23 days vs the trend it was on with nearly 14% over 146 days. This looks like an anomaly and maybe some outside factors played a role in this spike. I would expect it to settle back in to it’s health trend soon. It’s certainly on the rise, but working on the data alone I wouldn’t expect it to continue at this new aggressive rate. It’s more likely it will establish a new resistance level, but my guess is it will settle back into it’s current trend and coming back to this $560 range in a more healthy way in around Feb/Mar of 2022. If a new resistance level is established we could see it hitting $600+ in Feb/Mar 2022 instead.
I took a not so scientific look at the resistance levels. It appears the stock skips along the resistance line for an average of 60 days (looked at this pre-COVID and also what it’s doing now - it can be longer or shorter). At the end of each cycle a new resistance level is created. This stock was about establish a new resistance level when it broke out.
Semiconductors sector is an interesting industry. If Broadcom keeps delivering and the demand keeps increase; I expect it to continue to rise. Certainly not financial advise and I’m still learning here. Again, if I missed anything or if there are any tools, indicators or strategies that I could be applying to get better results I would love to hear them.
