AVGO Long1. Broader Market Structure
1.1 Change of Character (CHoCH)
A clear Change of Character occurred at $290.53, where price broke below a prior higher low. This was a key early signal of a potential bearish reversal, as bullish momentum began to weaken and sellers stepped in with conviction.
1.2 Break
0.06 USD
4.94 B USD
43.21 B USD
About Broadcom Inc.
Sector
Industry
CEO
Hock E. Tan
Website
Headquarters
Palo Alto
Founded
1961
ISIN
ARBCOM4603J5
Broadcom Inc. is a global technology company, which designs, develops, and supplies semiconductors and infrastructure software solutions. It operates through the Semiconductor Solutions and Infrastructure Software segments. The Semiconductor Solutions segment refers to product lines and intellectual property licensing. The Infrastructure Software segment relates to mainframe, distributed and cyber security solutions, and the FC SAN business. The company was founded in 1961 and is headquartered in Palo Alto, CA.
Related stocks

AVGO: Too Many Similarities Market WideLike my chart on BKNG, AVGO is showing an uncanny similarity to Booking.com's chart. Many indices are showing the end of 5 waves in a super cycle dating back to the drop of March 2020. AVGO pt1 is 211. Expecting selling to increase over the next 90 days. Not certain what the catalyst will be, but lo
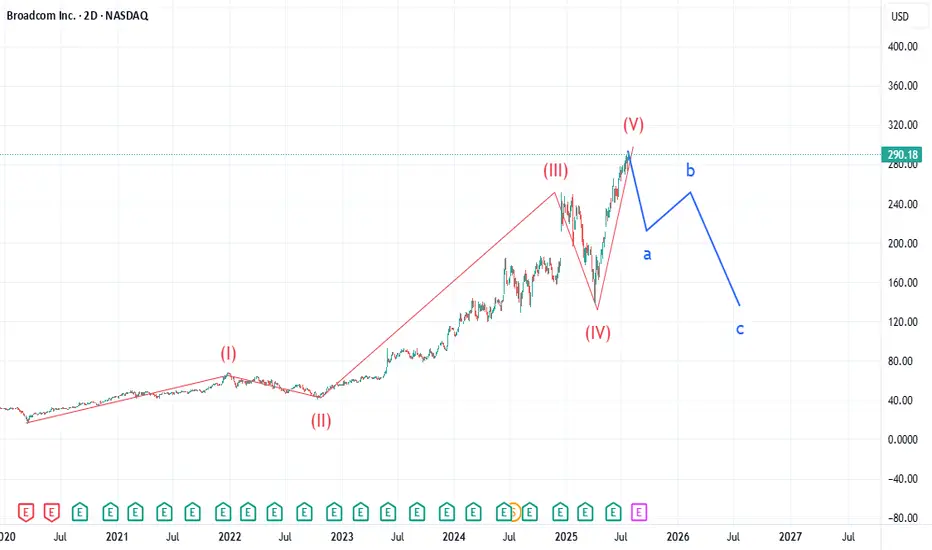
Broadcom: Positioned for Long-Term Growth in AI and EnterprisesCurrent Price: $283.34
Direction: LONG
Targets:
- T1 = $292.00
- T2 = $305.00
Stop Levels:
- S1 = $280.00
- S2 = $275.00
**Wisdom of Professional Traders:**
This analysis synthesizes insights from thousands of professional traders and market experts, leveraging collective intelligence to ide
Steal the Breakout: Broadcom Bulls Are In!💎🔓 "Broadcom Break-In: Bullish Vault Raid in Progress!" 🔓💎
🌟Hi! Hola! Ola! Bonjour! Hallo! Marhaba!🌟
Dear Money Makers & Market Robbers 🤑💰✈️,
It’s time for a high-stakes raid on BROADCOM, INC (AVGO) — all based on our secret Thief Trading Strategy™, combining sharp technicals & a sniff of fundamen

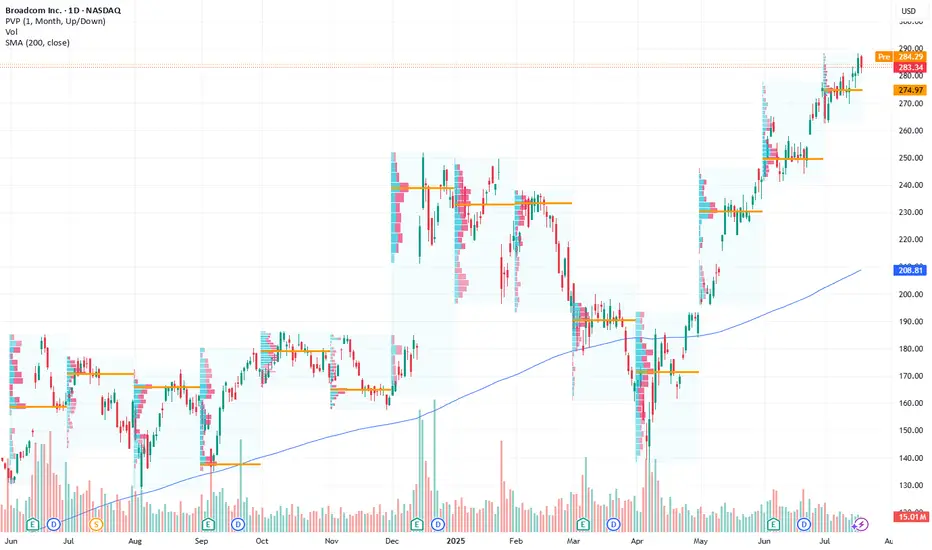
AVGO ( Broadcom.Inc ) NASDAQ:AVGO - Continuation of movement within the ascending channel + potential for a breakout to new historical highs. 🔍 Rationale:
• After a strong correction in the first quarter of 2025, the price formed a reversal and has been moving in a clear ascending channel since the beginning of May.
• T

Broadcom Topped?3 Weeks ago AVGO put in a topping tail candle on the weekly and for the past 3 weeks it has failed to close above the topping tail on a weekly basis. I've also highlighted some bearish divergence on the RSI. The topping tail will remain the dominant candle unless AVGO can close above the high of the

here is the #chart for $AVGOBullish with high expectations. Broadcom ( NASDAQ:AVGO ) is at $269.35, down 0.30% daily but up 11.28% monthly, as shown in the finance card above. X posts and analyst upgrades (HSBC to $400, Bernstein to $295) reflect strong optimism, driven by AI chip demand (projected $28.4B in 2026, $42.8B in 20

Broadcom - This was just the first all time high!Broadcom - NASDAQ:AVGO - just created new highs:
(click chart above to see the in depth analysis👆🏻)
Over the course of the past three months, Broadcom has been rallying an impressive +80%. However looking at market structure, all of the previous "dump and pump" was not unexpected. Following th


$AVGO above its previous ATH and holding on. 400 $ reachable. The poster child of the AI rally has been NASDAQ:NVDA and $AVGO. Here we have analysed both the stocks multiple times fundamentally and technically. But the lesser known NASDAQ:AVGO has performed better than the NASDAQ:NVDA since the April lows. NASDAQ:AVGO is still above its previous ATH an

See all ideas
Summarizing what the indicators are suggesting.
Oscillators
Neutral
SellBuy
Strong sellStrong buy
Strong sellSellNeutralBuyStrong buy
Oscillators
Neutral
SellBuy
Strong sellStrong buy
Strong sellSellNeutralBuyStrong buy
Summary
Neutral
SellBuy
Strong sellStrong buy
Strong sellSellNeutralBuyStrong buy
Summary
Neutral
SellBuy
Strong sellStrong buy
Strong sellSellNeutralBuyStrong buy
Summary
Neutral
SellBuy
Strong sellStrong buy
Strong sellSellNeutralBuyStrong buy
Moving Averages
Neutral
SellBuy
Strong sellStrong buy
Strong sellSellNeutralBuyStrong buy
Moving Averages
Neutral
SellBuy
Strong sellStrong buy
Strong sellSellNeutralBuyStrong buy
Displays a symbol's price movements over previous years to identify recurring trends.
Curated watchlists where AVGOD is featured.


