Positive patterns in Boeing.Let's check about this flag and double bottom in BA. One needs to take risks on such flags - what can be better than this, though execution is always tricky.
BAD trade ideas

BOEING - The path continues with some great news!You see since my last long analysis on Boeing , they had some issues and reported bad earnings, but the stock remained in its range and continues its path up again as it should. What helped the stock gaining was Trumps deal with some middle east country on Boeing military Jets. But this is not the main reason why it will rise again fast , its because of its new 777x coming in the next years such as more possible 737max orders after the 737max is gaining again a safe status.

Long Opportunity Amid Market Stabilization
Targets:
- T1 = $208.00
- T2 = $214.00
Stop Levels:
- S1 = $198.00
- S2 = $192.50
**Wisdom of Professional Traders:**
This analysis synthesizes insights from thousands of professional traders and market experts, leveraging collective intelligence to identify high-probability trade setups. The wisdom of crowds principle suggests that aggregated market perspectives from experienced professionals often outperform individual forecasts, reducing cognitive biases and highlighting consensus opportunities in Boeing.
**Key Insights:**
Boeing is strategically positioned to capitalize on the ongoing recovery of the aerospace industry. Continued robustness in the demand for commercial aircraft, coupled with expected growth in global air travel, supports a positive outlook. Recent announcements regarding increased production capacity have further established the company’s competitive edge. Notably, while positive sentiment surrounds these factors, macroeconomic uncertainties like higher interest rate sensitivities and geopolitical risks must still be factored into trading strategies.
Boeing’s focus on ramping up 737 Max deliveries and addressing supply chain issues instills additional confidence in its revenue generation potential. Furthermore, the firm remains well-diversified through its defense and space sectors, providing resilience against economic cycles and key growth drivers.
**Recent Performance:**
Over the previous week, Boeing's stock saw stable price consolidation near the $200 mark, signaling investor caution amidst broader market volatility. While failing to break above notable resistance levels at $205, the stock showed downward support strength and signs of buyers stepping in. This stabilization phase suggests a possible setup for an upward breakout, should broader market sentiment firm up.
**Expert Analysis:**
Market analysts remain bullish on Boeing’s long-term prospects, citing its inherent strengths, like a solid order backlog and easing concerns regarding certification delays. Another notable catalyst includes the upcoming production ramp-ups to meet revived airliner demand. Critically, technical factors indicate a budding bullish trend, supported by the $200 psychological barrier and key moving averages converging below current price levels. However, short-term cautious optimism is warranted due to mixed earnings surprises and complex macroeconomic crosswinds.
**News Impact:**
Recent headlines highlight improved production outlooks for Boeing’s signature aircraft models, which have increased confidence among institutional investors. Moreover, hints of regulatory relief in addressing past compliance challenges further demonstrate positive developments for risk-averse participants. Despite these tailwinds, overarching concerns about inflation, global economic cooling, and foreign policy tensions could weigh heavily on investor sentiment.
**Trading Recommendation:**
For traders, Boeing’s current setup provides a reasonable risk-reward ratio for a long position. The convergence of improved fundamentals, stable technicals, and expanding growth prospects indicates potential for a breakout above $205, with price targets in the $208-$214 range. As with any trade, a disciplined approach to stop-loss placement (below $198 and $192.50) minimizes exposure to downside risks while capitalizing on Boeing’s industry leadership and growth opportunities.
BA - Lowering Altitude - PullbackGood Morning,
Hope all is well. Big flight with BOEING has taken off.
April 7th 2025 - Initial BA Support @ 128.83$
May 7th 2025 - Break of previous market trend @ 184.87$
May 8th 2025 - Large volume buying, confirmation of new trend.
May 13th 2025 - Pullback initiated @ 210.11$
If you are long continue to hold long - if you are day trading, good opportunities to take advantage of the pull-back.
BA never technically confirmed a new support at 188.00$, the stock could be pulling back to confirm. A hold at either support level below would indicate continued bullish movement. A break of these levels could indicate weakness in trend.
Support #1 - 188.00$
Support # 2 - 182.03$
Enjoy!

BA watch $186 above 173 below: Golden Genesis fib may give DipBA flying back up from the tariff bottom.
Approaching a Golden Genesis fib at $186.76
We should see a dip soon, possibly to $173.40

Strong Support, Bullish Setup – Boeing Poised to Reclaim $448Since the Monday, March 2, 2020 candle, Boeing's stock has been trading within a consolidation zone. The price action formed a critical double bottom around the $107.95 region, establishing this level as a strong support zone. This zone has been tested twice and held firmly, signaling robust buying interest and a base formation for a potential long-term uptrend.
🔵 Long-Term Trajectory
The stock is trending within a clearly defined upward price channel marked by two parallel blue trendlines.
The Lower Price Levels in Upward Trajectory have acted as reliable support since the early 2000s.
The Upper Price Levels in Upward Trajectory reflect long-term resistance where price has historically faced selling pressure.
The recent price action has respected the lower boundary of this channel, bouncing off it and heading upward, suggesting bullish momentum is returning.
🔴 Resistance and 🟢 Support Zones
Strong Support Region: $107.95
This is a historically defended level, with long-term demand and a significant reversal observed in past cycles.
Resistance for Shorter Timeframe: $273.93
Price may face selling pressure here. Conservative traders could aim for this TP1 level in the medium term.
Resistance for Higher Timeframe: $448.05
This is a major target (TP2) based on historical resistance levels. The breakout beyond this level would require strong bullish catalysts, but reaching this level is a likely scenario if the current upward channel continues to hold.
📌 Key Levels
• Current Price: $204.72
• Stop Loss: $130 (for long-term position)
This level is beneath the lower consolidation zone and still within the long-term channel—risk is managed accordingly.
• TP1: $273.93
• TP2: $448.05
For shorter-term traders, it's advised to set stop-loss levels based on individual Risk-to-Reward (RR) ratios and market volatility. The range between $130 and $273.93 provides sufficient space to capture shorter-term gains.
🔁 Consolidation Period & Momentum Shift
The "Last Candle Before Consolidation Period" noted in 2020 marked the beginning of prolonged sideways movement. This base-building phase typically precedes strong directional moves. The breakout from this zone and current monthly candle activity above $200 suggest a renewed bullish phase is underway.
💼 Boeing Fundamentals – A Strong Backing for Technical Setup
Boeing remains one of the world’s largest aerospace and defense companies, with a robust order book, government contracts, and recovering commercial aviation demand. Despite past setbacks, including the 737 MAX grounding and pandemic-related disruptions, Boeing has taken strategic steps to:
• Restore investor confidence
• Strengthen its balance sheet
• Increase aircraft deliveries
With increasing global air travel and heightened defense spending, Boeing’s fundamentals support the bullish technical outlook.
This chart analysis suggests a strong long-term bullish opportunity for Boeing (BA). With price bouncing off historical support, and currently respecting the long-term upward channel, the potential to reach TP2 at $448.05 is both technically and fundamentally supported.
🔒 Stop loss at $130 protects against downside while allowing room for volatility.
📈 TP1 at $273.93 for cautious traders, and TP2 at $448.05 for those holding long-term.
Always assess RR ratios and market conditions before entering trades, and adjust your stop-loss dynamically if you're trading short-term.

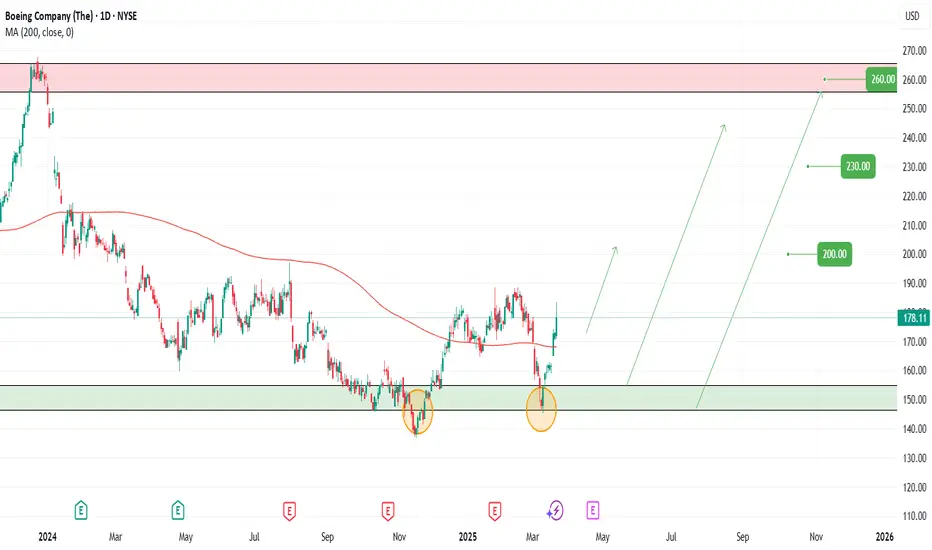
BA (Boeing Co.) – Trade Setup Alert🚀✈️ A major new defense contract is on the horizon — and if confirmed, it could skyrocket BA’s valuation to new heights. This could be the catalyst that propels the stock far beyond its current range.
Boeing is showing renewed strength with a bullish setup developing. With multiple entry points and solid upside targets, this trade offers compelling potential for swing traders and long-term investors alike.
📌 Entry Points:
1️⃣ Market Price
2️⃣ $162
3️⃣ $147
🎯 Profit Targets:
✅ $200
✅ $230
✅ $260
⚠️ Disclaimer: This is not financial advice. All trading involves risk. Please do your own research or consult a licensed financial advisor before making investment decisions.
A potential setup on BA soon?OptionsMastery:
🔉Sound on!🔉
📣Make sure to watch fullscreen!📣
Thank you as always for watching my videos. I hope that you learned something very educational! Please feel free to like, share, and comment on this post. Remember only risk what you are willing to lose. Trading is very risky but it can change your life!

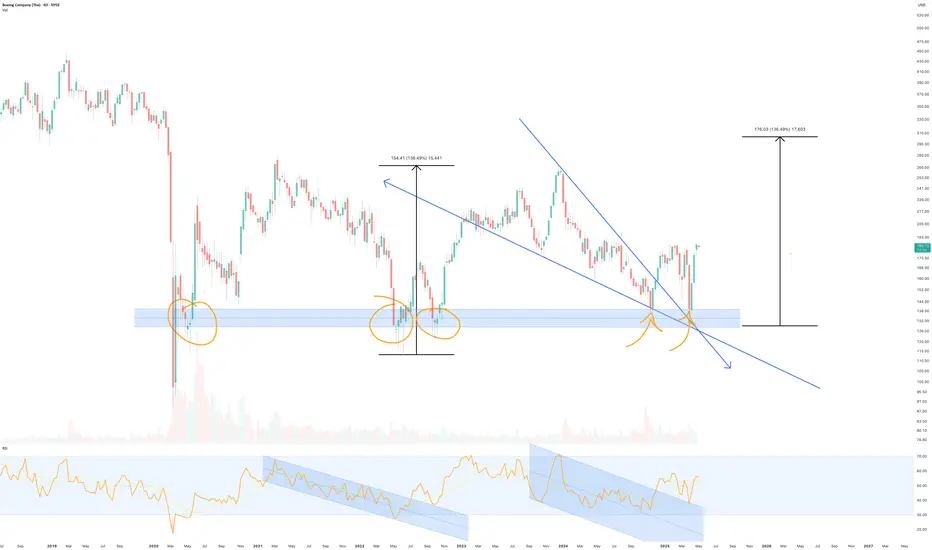
Boeing to $300 - Falling wedge** The year ahead **
On the above 6 day chart price action has corrected over 50% since December 2023. A number of reasons now favour a long position, they include:
1. Price action and RSI resistance breakouts.
2. Support on past resistance.
3. Double bottom on price action (yellow arrows)
4. Falling wedge breakout confirmation with forecast to $300 area
5. The Majority of other traders are bearish. Remember, trading has a high fail rate.
www.tradingview.com
Is it possible price continues to correct as others suggest? For sure.
Is it probable? No.
Ww
Type: Trade
Risk: <= 6% of Aerospace & Defence
Return: 60% from current levels
Stop loss: Will say elsewhere
$BA Been Basing About 1 Year – Ready to Break-out?I am already long NYSE:BA since earnings report on April 23 with a full size position. I am looking for this to form a short flat base to allow the 10 (purple) and twenty ema (blue) to catch up. I will be looking to add to my position if that happens and it resumes the uptrend. Since it bottomed out on April 7th it has made about a 45% move. That is why I think my scenario may play out. All TBD.

boeing SHORTIn this trade the idea is to follow the price of the lateral channel then we see how there is a strong ob that confirms the price below making it confirm the short.

Boeing LongBA is now net long on the regression break.
I am not taking this trade as it has hit the range high and the market is volitile.

Boeing (BA, 1W) Falling Wedge + H-Projection TargetOn the weekly chart, Boeing has formed a classic falling wedge — a bullish reversal pattern that typically signals the end of a correction phase. After a sharp decline from $267.97 to $138, price action began to compress within a wedge, forming lower highs and higher lows on declining volume — a textbook setup for a breakout.
The structure remains active: a confirmed breakout above the upper wedge boundary, with a retest near $181.60 (0.618 Fibonacci retracement), would validate the pattern and trigger the next upward phase.
The projected move (H) equals the height of the previous impulse — $130.02. Adding this to the base of the wedge (~$138) yields a technical target of $268.00, aligning with the previous high and completing the structural recovery.
Technical summary:
– Multiple confirmations of wedge support
– Volume declining into the apex (bullish)
– Entry zone: breakout + retest at $181.60
– Mid-level resistance: $198.09 (0.5 Fibo)
– Final target: $267.97–$268.00 (H-projection complete)
Fundamentals:
Despite operational setbacks, Boeing remains structurally positioned for recovery as demand for commercial aircraft rebounds. Additional support could come from improving supply chains, increased defense contracts, and a more dovish outlook from the Federal Reserve heading into 2025.
A breakout above $181.60 and sustained momentum would confirm the falling wedge pattern and activate the H-measured move toward $268. This is a structurally and fundamentally supported mid-term recovery setup

BOEING EARNINGS ABOUT TO PRINT Fundamental Outlook NYSE:BA
Boeing is heading into its Q1 2025 earnings with notable challenges. Ongoing quality-control issues, supply chain disruptions, and a reported negative profit margin are creating headwinds. Additionally, recent negative publicity surrounding production delays and regulatory scrutiny may further dampen investor sentiment. While potential defense contract wins or positive updates on 737 MAX production could provide a lift, the risk of a disappointing earnings report remains high, especially in a volatile aerospace sector.
Technical Analysis (Using Bollinger Bands Strategy)
On the 4-hour chart, Boeing’s stock price is currently trading at $175.46, as seen in the provided chart. Applying Bollinger Bands, the price has recently broken below the lower band, signaling a potential oversold condition but also confirming a strong bearish momentum. The price has been trending below the 20-period moving average within the bands, with the bands widening—a sign of increased volatility. This setup suggests a continuation of the downward move, especially with the recent sharp decline highlighted by the red arrow in the chart.
Target
Wait for bearish confirmation
Entry SHORT: Around $165.50, Targeting $152.00.
Secondary Target: $146.00.
Resistance Levels: $180.00, $185.00, $188.60.
Support Levels: $165.00, $155.00, $148.00.
The price is struggling to reclaim the 20-period moving average, and with earnings approaching, a breakdown below $170.00 could accelerate the decline toward $165.00 or lower. However, a positive earnings surprise—such as strong delivery numbers or improved guidance—could push the price back toward the upper Bollinger Band near $185.00.
QuantSignals.
Best AI news analysis and signals

BA Weekly Options Trade Plan 2025-04-15NYSE:BA BA Weekly Analysis Summary (2025-04-15)
Below is our synthesis of the various models, followed by our final trade conclusion and details.
──────────────────────────────
Comprehensive Summary of Each Model’s Key Points
• Grok/xAI Report – Technicals on BA show that the price (about $155.52) is below the short‐term (and even daily) moving averages with a 5‑minute RSI well into oversold territory (24.71). – The MACD is negative while Bollinger Bands show price near the lower edge. – Market sentiment (including bearish headlines and high put open interest) supports a view of further downside, despite a touch of potential mean‐reversion. – Recommendation: Buy a naked put at the $150 strike (premium ~$0.88) to play a moderately bearish view.
• Gemini/Google Report – Confirms that on a 5‑minute chart BA is trading below key EMAs and shows strong bearish momentum on MACD. – However, the extremely oversold 5‑minute RSI and the fact that the max pain is at $160 (well above current price) introduce a counter‐signal suggesting a possible bounce. – Conclusion: The directional bias is ambiguous; the risk of entering a short when a bounce may occur makes trade timing uncertain. No clear open‐trade setup is recommended.
• Llama/Meta Report – Also notes that BA’s price is below key short‑term moving averages and that the MACD is on the downside. – But Llama points out that the max pain level at $160 and relatively low call premium (e.g. $162.50 call at $0.54) might offer a speculative play on an upward move. – Recommendation: Buy the $162.50 call as a hedge/speculative play, citing the potential for a rally toward the max pain.
• DeepSeek Report – Reiterates the technical picture: BA is trading below its key MAs, the 5‑minute RSI is oversold, and there is strong bearish open interest in puts (notably at the $150 strike). – Their analysis supports a moderately bearish outlook despite the risk of a short‐term bounce. – Recommendation: Buy the $150 July (weekly) put at $0.88, with exit triggers set if BA regains short‑term resistance.
────────────────────────────── 2. Areas of Agreement and Disagreement
• Agreement: – All models agree that BA is trading below key short‑term moving averages and that the 5‑minute technicals (including an extremely low RSI and negative MACD) point to bearish momentum. – There is consensus that options data (with max pain at $160 and strong put open interest at $150) provides key reference points.
• Disagreement: – While Grok and DeepSeek lean into a bearish trade via the $150 put, Gemini highlights conflicting signals (oversold RSI versus bearish momentum) and recommends caution at the open. – Llama instead sees potential for a bounce upward towards max pain and recommends a call trade. – The conflict centers on whether the oversold condition could force a short-term bounce (favoring calls or no trade) versus the prevailing bearish trend (favoring puts).
────────────────────────────── 3. Clear Conclusion
Overall Market Direction Consensus: The majority of the analyses show that while BA has an oversold 5‑minute RSI hinting at a possible short-term bounce, the price action below key EMAs, the negative MACD, bearish news, and heavy put open interest largely indicate a moderately bearish outlook. The ambiguity in the immediate open (as noted by Gemini) is acknowledged, but overall the consensus leans toward further downside pressure.
Recommended Trade: Since we must trade single‑leg, naked options on weekly expiries and we choose one of the provided strikes/prices, we favor the moderately bearish stance. Hence our recommendation is to buy a naked put option.
Trade Parameters: • Instrument: BA • Trade: Buy weekly puts • Strike: $150.00 • Premium: $0.88 (as shown in the current options data) • Expiration: 2025‑04‑17 • Entry Timing: At open • Rationale: This put offers a bearish play that earns from continued downside momentum, even if there is a brief bounce. Liquidity is supported through high open interest and volume at this strike. • Confidence Level: Approximately 65% • Risk/Reward Guidelines: A target exit is set for a roughly 50% profit on the premium (aiming for an option price near $1.32), while a stop‐loss is triggered if BA recovers and breaches key short‑term resistance (around the $156 range) – roughly limiting losses to 50% of the premium.
Key Risks and Considerations: – There is a risk that the oversold condition (RSI at 24.71) could spark a swift bounce, forcing the trade into near‐term losses. – The max pain level at $160 could create upward pressure as expiration nears. – Volatility as indicated by the VIX (30.12) remains elevated, so sudden price swings are possible. – Traders should carefully size positions (not more than 2–3% of account capital) and defend profit targets and stops to limit risk.
────────────────────────────── 4. TRADE_DETAILS (JSON Format)
{ "instrument": "BA", "direction": "put", "strike": 150.0, "expiry": "2025-04-17", "confidence": 0.65, "profit_target": 1.32, "stop_loss": 0.44, "size": 1, "entry_price": 0.88, "entry_timing": "open" }
Disclaimer: This newsletter is not trading or investment advice but for general informational purposes only. This newsletter represents my personal opinions based on proprietary research which I am sharing publicly as my personal blog. Futures, stocks, and options trading of any kind involves a lot of risk. No guarantee of any profit whatsoever is made. In fact, you may lose everything you have. So be very careful. I guarantee no profit whatsoever, You assume the entire cost and risk of any trading or investing activities you choose to undertake. You are solely responsible for making your own investment decisions. Owners/authors of this newsletter, its representatives, its principals, its moderators, and its members, are NOT registered as securities broker-dealers or investment advisors either with the U.S. Securities and Exchange Commission, CFTC, or with any other securities/regulatory authority. Consult with a registered investment advisor, broker-dealer, and/or financial advisor. By reading and using this newsletter or any of my publications, you are agreeing to these terms. Any screenshots used here are courtesy of TradingView. I am just an end user with no affiliations with them. Information and quotes shared in this blog can be 100% wrong. Markets are risky and can go to 0 at any time. Furthermore, you will not share or copy any content in this blog as it is the authors' IP. By reading this blog, you accept these terms of conditions and acknowledge I am sharing this blog as my personal trading journal, nothing more.

BA - downtrend continuesIn chart week frame, MA50/ MA200, MACD show downtrend for MA continues.
Strong support at $121.02.
The pattern head and shoulders not completed so downtrend continues to $121.02 (maybe on middle of June).
Now price: $155.52.
IMO amateur trader.

Boeing victim of tariffs on airline ordersBy Ion Jauregui - Market Analyst, ActivTrades
The direct impact of tariffs on airlines
Airlines, traditionally oblivious to trade tensions, could be directly affected by proposed new U.S. tariffs on steel, aluminum and imported aircraft. Ryanair CEO Michael O'Leary's recent warning that they could delay the delivery of 25 Boeing aircraft if these tariffs are implemented highlights the scale of the challenge.
The Trump administration's proposal includes a 25% levy on steel and aluminum - key materials in aircraft construction - and 10% on imported finished aircraft. This measure would have a direct impact on manufacturers' production costs, which would inevitably be passed on to airlines, either through price increases or delivery delays.
Operational risks and pressure on the supply chain.
In the specific case of Ryanair, the aircraft that were due to join its fleet as of August may not be available before March or April 2026. This scenario, in the midst of a recovery in air demand in Europe, would be a major constraint on its operational capacity. In addition, Delta Air Lines has also shown concern about Airbus deliveries, reflecting that the risk is not limited to one manufacturer.
The airline industry, highly dependent on a global supply chain, thus faces potential disruption at a time when air traffic growth demands additional capacity. If tariffs are confirmed, we could see escalating costs, reduced aircraft availability and pressure on industry margins.
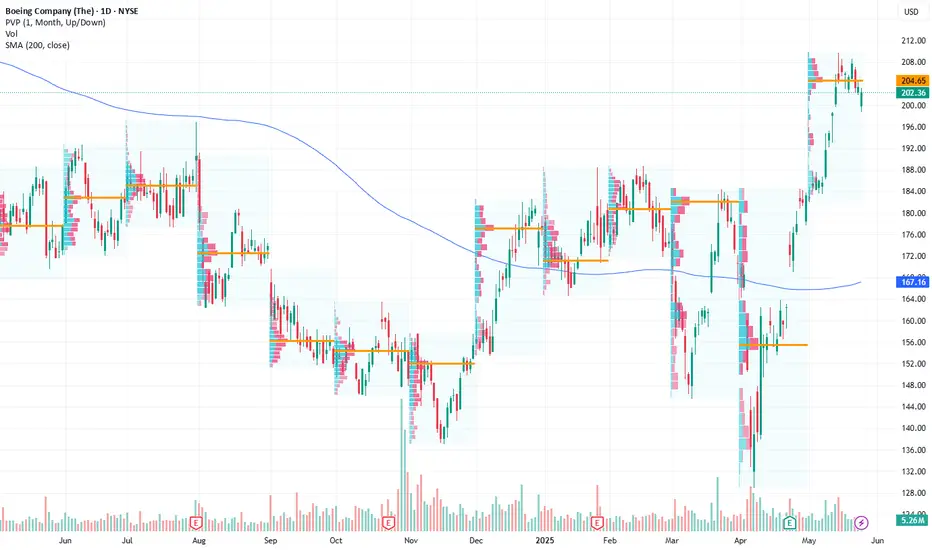
Boeing Technical Analysis
Looking at Boeing's (BA) performance over the past year, the stock has moved between $240 and $163, with a lower seasonality range of $184 and $163.50 on the downside with recent lows at $128.89, reflecting the impact of the adverse political and trade environment. This range marks the extremes between the Christmas rally and the recent drop triggered by the uncertainty of tariffs, what some are already calling the TrumpDump and TrumpPump effect, because of the swings originating from the X/Twitter announcements.
The Point of Control (POC) currently stands at around $155.95, representing the average price of volume traded within the recent market structure. The RSI is at 52.18%, a slightly overbought zone after the previous strong oversold condition. Technically, the stock is showing bearish signals: a death crossover has occurred on the 4-hour chart, with negative expanding moving averages, indicating that the stabilization zone could be closer to the POC than to the pre-dip levels.
Conclusion: a trade war that hits its own industry
The tariffs, which seek to protect the domestic industry, could be severely damaging one of the emblems of U.S. aviation. Companies like Boeing are “quasi-critically” affected, losing competitiveness to rivals like Airbus in Europe or Asian manufacturers that do not face such tax burdens. In this volatile environment, it will be essential to closely monitor political decisions and their economic implications on strategic sectors such as aviation, where investment and operator confidence depend on a stability that today seems to be at stake.
*******************************************************************************************
The information provided does not constitute investment research. The material has not been prepared in accordance with the legal requirements designed to promote the independence of investment research and such should be considered a marketing communication.
All information has been prepared by ActivTrades ("AT"). The information does not contain a record of AT's prices, or an offer of or solicitation for a transaction in any financial instrument. No representation or warranty is given as to the accuracy or completeness of this information.
Any material provided does not have regard to the specific investment objective and financial situation of any person who may receive it. Past performance is not reliable indicator of future performance. AT provides an execution-only service. Consequently, any person acting on the information provided does so at their own risk.

Boeing: A Strategic Long Play Amid Market Volatility
- **Key Insights:** Boeing presents an interesting long opportunity as it
navigates geopolitical headwinds and supply chain pressures. The stock
remains supported by its diversified portfolio, particularly its promising
defense division, and near-term catalysts like tariff relief on certain
U.S.-China trade goods. Key technical levels indicate consolidation,
offering potential for upside if resistance is breached.
- **Price Targets:**
- Next Week Targets: T1 = $160.50, T2 = $165.50
- Stop Levels: S1 = $151.00, S2 = $149.00
- **Recent Performance:** Boeing is trading at $155.52, reflecting broader
equity market volatility. Short-term fluctuations are driven by geopolitical
developments, while the aerospace segment remains cyclically pressured.
Despite challenges, Boeing shows resilience with its defense sector showing
strong demand potential in NATO-aligned nations.
- **Expert Analysis:** Analysts highlight Boeing’s dual exposure to commercial
and defense markets, making it less vulnerable to a single industry
downturn. While competition from Airbus and U.S. export controls pose
challenges, Boeing’s strong position in military technology and space
exploration offers stability. Downside concerns focus on supply chain
disruptions, rising costs, and uneven global travel recovery, though these
risks are partially mitigated by a projected rebound in key market segments
through 2024.
- **News Impact:** Key developments like tariff exemptions on specific tech
imports add positive trade sentiment, potentially boosting long-term supply
agreements with China. Defense budget increases in Western markets create
opportunities for Boeing’s fighter jets and surveillance systems, bolstering
its financial outlook. Meanwhile, supply chain strains and inflation persist
as headwinds but are showing signs of easing amid diplomatic improvements.
Boeing offers a calculated long opportunity driven by sector strength, improved
trade prospects, and defense demand. Investors should watch the $150-$160 range
closely for tactical entries and monitor global events impacting aerospace and
defense markets.

Boeing ($BA) Faces Renewed Scrutiny After Latest Safety ConcernsBoeing (NYSE: NYSE:BA ) stock closed at $156.84 on April 11, gaining 0.85% despite fresh concerns surrounding delayed aircraft deliveries. China's Juneyao Airlines recently postponed the delivery of a 787-9 Dreamliner, originally valued at $120 million. The decision comes amid renewed U.S.-China trade tensions driven by tariff escalations from President Trump’s administration.
This delay could disrupt Juneyao’s planned expansion into European routes this summer. The Dreamliner, known for its long-range capabilities, was central to these international plans. The incident signals how geopolitical strain continues to impact global aviation and commercial aircraft deals.
Boeing has already cautioned that additional tariffs may put more pressure on supply chains. These chains had only recently begun to stabilize following years of pandemic-related disruptions. The company remains exposed to evolving international policies, which can affect order fulfillment and investor sentiment.
Earnings for Boeing are expected on April 23, 2025. Investors are watching closely for guidance on production capacity, deliveries, and any fallout from global trade developments.
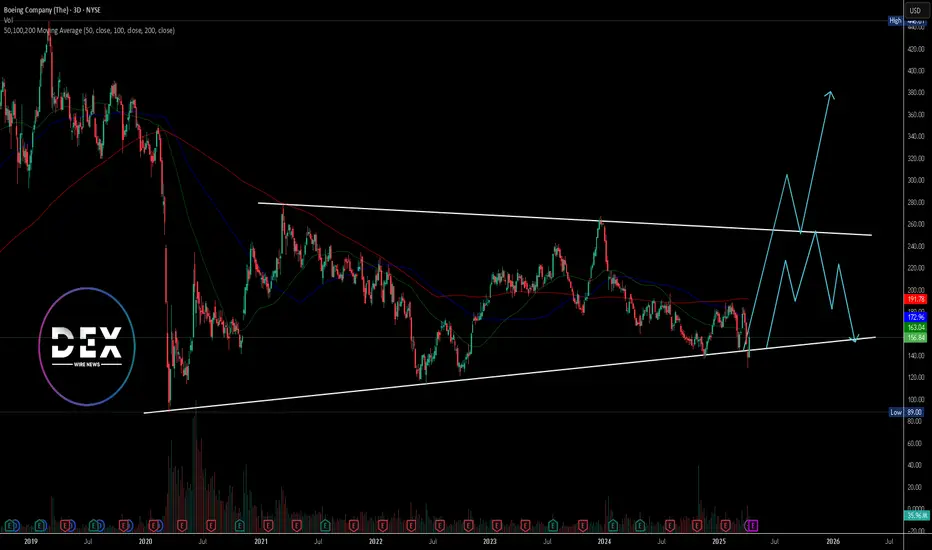
Technical Analysis
Boeing is trading within a broad wedge pattern marked by long-term support and resistance trendlines. Price recently bounced from the support, rising sharply to the current level of $156.84. The 50, 100, and 200-day moving averages sit at $163.04, $172.96, and $191.78 respectively.
These levels now act as dynamic resistance. Price remains below all three, signaling overall bearish pressure unless a breakout occurs. A breakout above the resistance trendline may lead to a rally. However, if price fails to gain momentum and breaks below the lower trendline, it could revisit the $89 low from 2020.
Boeing (BA) Share Price Rally Slows Near Key ResistanceBoeing (BA) Share Price Rally Slows Near Key Resistance
The Boeing (BA) stock chart shows that since its March low, the price has surged by approximately 25%, significantly outperforming the S&P 500 index (US SPX 500 mini on FXOpen).
This rally was driven by the news that Boeing secured a contract to develop the next generation of fighter jets for the U.S. Navy, beating its main competitor, Lockheed Martin.
According to Business Insider, this success is tied to Boeing’s development of the F-47 fighter jet under the Next Generation Air Dominance (NGAD) programme, which will bring the company contracts worth around $20 billion.
Technical Analysis of Boeing (BA) Stock
Throughout March, bulls managed to break through local resistance around $172 (as indicated by orange arrows). However, the rally has now reached a stronger obstacle—the $188 level:
This area marks the 2025 high.
Bulls also struggled to sustain prices above $188 in mid-2024.
With the RSI indicator nearing overbought levels, a correction after such an impressive two-month rally seems like a plausible scenario.
This article represents the opinion of the Companies operating under the FXOpen brand only. It is not to be construed as an offer, solicitation, or recommendation with respect to products and services provided by the Companies operating under the FXOpen brand, nor is it to be considered financial advice.

BA: Perfect shakeoutBA: Perfect shakeout
-Big consolidation on Inversed Head n Shoulder range.
-Big successful shakeout with less supply volume.
-Next consolidation to confirm right shoulder with specific range as image.
.
Let's wait n see!

BA Now Cost $248The market dances in the same Rythm for decades. Gap Closure at $244/248
The news with the new military stealth is just the beginning of this market manipulation to get the previous orders before they make another plane go down.

What Rules the Skies Now?In a landmark decision reshaping the future of aerial warfare, Boeing has secured the U.S. Air Force's Next Generation Air Dominance (NGAD) contract, giving rise to the F-47, a sixth-generation fighter poised to redefine air superiority. This advanced aircraft, succeeding the F-22 Raptor, promises unprecedented capabilities in stealth, speed, maneuverability, and payload, signaling a significant leap in aviation technology. The F-47 is not conceived as a solitary platform but as the core of an integrated "family of systems," working in concert with autonomous drone wingmen known as Collaborative Combat Aircraft (CCAs) to project power and enhance mission effectiveness in contested environments.
The development of the F-47 directly responds to the evolving global threat landscape, particularly the advancements made by near-peer adversaries like China and Russia. Designed with a focus on extended range and superior stealth, the F-47 is specifically tailored to operate effectively in high-threat regions, such as the Indo-Pacific. Years of clandestine experimental flight testing have validated key technologies, positioning the F-47 for a potentially accelerated deployment timeline. This next-generation fighter is expected to surpass its predecessors in critical areas, offering enhanced sustainability, supportability, and a reduced operational footprint, all while potentially costing less than the F-22.
The designation "F-47" itself carries historical and symbolic weight, honoring the legacy of the World War II-era P-47 Thunderbolt and commemorating the founding year of the U.S. Air Force. Furthermore, it acknowledges the pivotal role of the 47th President in supporting its development. Design elements observed in early visualizations hint at a lineage with Boeing's experimental aircraft, suggesting a blend of proven concepts and cutting-edge innovation. As the F-47 program moves forward, it represents not only a strategic investment in national security but also a testament to American ingenuity in maintaining its dominance of the skies.
