$BA - Can we see it as trend line retest?In my previous chart, I mentioned that BA could play out double bottom and it did.
Since then, BA has pulled back and now retesting the descending wedge. Will it bounce from here, or will it break down like it did before?
It seems $230 area has been painfully stubborn area.
If it bounce from here and break above $210, there is a chance that it can see $230 again. If by some miracle, it breaks through $230, we can expect $245 area.
On the other hand, if it breaks down from here, it can revisit $185 area.
It's all depends on whether we stay above $199 or breaks below it.
Bullish target 1 - $230
Bullish target 2 - $245
Bearish target - $185
Earning on 01/26 (tmr) will determine if we see $230 or $185. We won't have to wait long.
———————————————————
How to read my charts?
- Matching color trend lines shows the pattern. Sometimes a chart can have multiple patterns. Each pattern will have matching color trend lines.
- The yellow horizontal lines shows support and resistance areas.
- Fib lines also shows support and resistance areas.
- The dotted white lines shows price projection for breakout or breakdown target.
Disclaimer: Do your own DD. Not an investment advice.
BAD trade ideas

$BA moment of truth...Big, big day tomorrow. Earnings that just so happen to fall on FED minutes day...could be a flier or a huge dump, happened to be successful yesterday buying $210 call and $220's at the bottom and selling $215's and $225's for the same price so I'm getting a free play for earnings. We'll see how it all shakes out tomorrow...

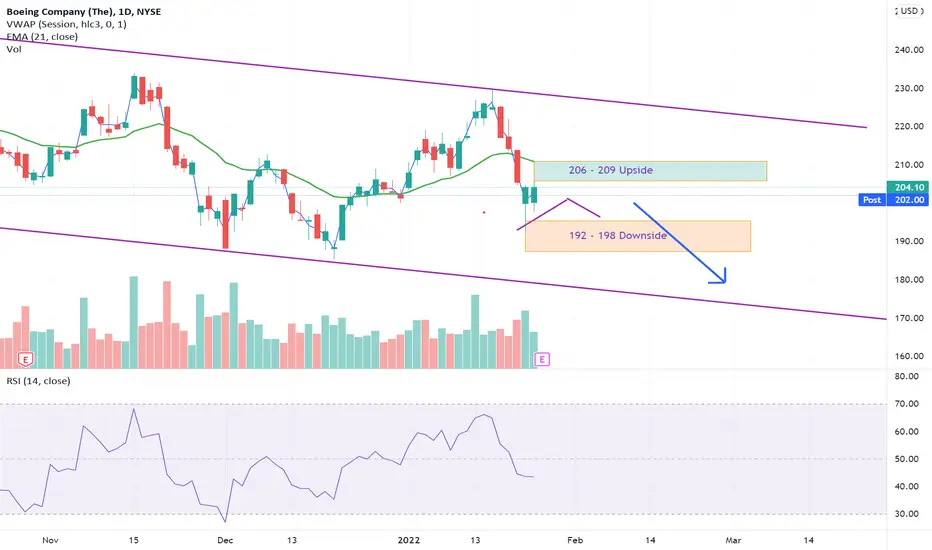
BA Intraday Outlook BA has been maintaining a bullish sentiment. On the daily, it looks like a potential bear flag; however, historically BA daily charts don't really follow through with bear flags. I expect maybe a V shaped path followed by a fall to the downside.
My linear regression model of BA shows to watch for highs of around 206 - 209 to the upside (there is strong resistance around 209 on the charts as well) and lows of 190-198. However, based on how BA traded yesterday, IMO if we fall below 194 we would be heading down aggressively. These values are adjusted (by me) based on the SD and chart support/resistance levels.
I would be short biased in the 206-209 region, long biased in the 195 - 198 region. If we fall below 194, I would be short biased for a bigger move.
I was originally swing trading a BA short from 205 tomorrow with an exit of 198 for tomorrow, but I ended up hitting buy instead of sell for SPY on a trade today and ended up accidently wiping out almost all of my earnings today (it took me 2 minutes to realize what I had done and SPY immediately started free falling once I hit that buy button of course). So I decided to take that profit at the end of day to just call it a break even day.
Tomorrow is going to be a disaster though, with earnings and FOMC meeting. These are things that can't really be accounted for in modelling so I am going to be extra cautious. However, based on SPY and DIA's behaviour, I expect a hard bearish start to the market tomorrow.
DISCLAIMER:
NOT FINANCIAL ADVICE!
I am not a financial planner or know anything about finance. I am an ex Nurse/Epidemiologist and literally am just inputting market variables into models used for infection rate case predictions, which has yielded mixed results over the year, but enough for me to support myself and dog :-).
I do my linear regression in SPSS so cannot show you the plots or histograms, but if you have any questions I would be happy to answer them!
$BA recovery with the market...What a crazy day in the market, BA tested under $200 and recovered to close solidly over $200 with the market rebound. Now we have earnings coming up pre-market Wednesday, still waiting on China MAX approval, a few potential catalysts to get this thing going back the right direction.

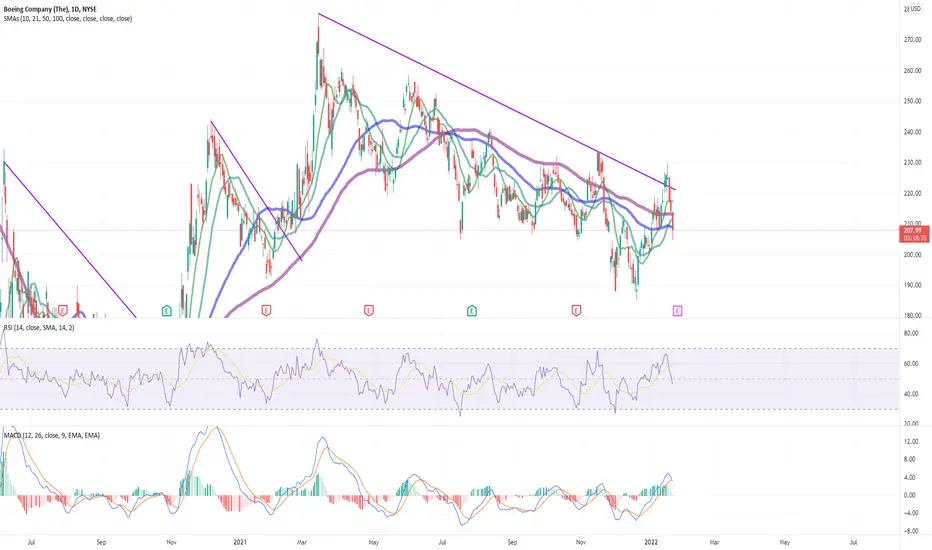
Boeing Downtrend on daily time frame, waiting for more correction and find a good entry for sell position

BA remains bearish We had a flat top bearish candle form yesterday on the daily chart with Heikin Ashi and it continued today.
Historically, from the formation of the flat top bearish trend, BA falls on average of 12%.
With earnings coming up next week (January 26th) I think we will have continued sell off.
There is also a lot of psychology backing my thinking. BA has been performing so poorly this year and has been THE biggest drag on my long term holdings. You can bet that I was quick to cut them loose once we came back to the 220s and took my profits there. I bet many other people who were invested in this long term are also looking to GTFO of their BA positions because it has just been such a drain this year, the company fundamentally is poorly managed and its future is being challenged with makers like Airbus and Embraer (I personally took the money I had invested in BA and moved it over to Airbus because of the clear display of poor management BA has had over the past 2 years, I was just greatful that I didn't have to take a loss).
My price target is $200 (10% pullback) and then $194 (13% pullback) if 200 support is broken. I could be wrong. Who knows. BA and TSLA are like the psycho ex that just doesn't listen and does things just to screw you over. But we will see!
Disclaimer: NOT financial advice. These are my opinions and I have been known to be wrong.

$BA not biting just yet...If we recover, there will be time to jump in, could be risk of $205 or $200 now, but with earnings next week let's just sit and wait for a full market recovery.

$BA continued weakness...Now that we blew through $220, I'm eyeing $212-$215 as the next line in the sand, if we drop hard tomorrow I'll just wait until we get some consolidation or news before hopping back in...

BA Scalp shortPossible BA scalp short , will update if I take entry w/ trade details below Possible entrys are 222 or break of 219.29 pending on the orderflow

strategy for BA Wednesday 01/19/2022BA: sell zone ( 229.00 ) ( 228.00 )
BA: buy zone ( 222.00 ) 221.00 )
strategy: in case of a break of the sell zone (230.00) bullish continuity.
bearish entry: in case of an opening below the sell zone or the closing price our exit must be in the buy zone

$BA failed launchpad...so far...Off to a great relative strength day today, got out at $228's when it couldn't hold. Will be back for more after we decide if we can hold the $220-$225 range...

BAWe did break the dow sloping resiatnce of this considation around 223$. Howver the key reistNce to watch is 234$ if we close above 234 all longs should be placed as that is our monster weekly resiatnce until that happens it’s easy for BA to fake out or pull back as this consildation range has chppped for months between 204-234 with 2 wicks to 187. That being said stay patient and ready for a break and hold above 234 until the i would sit on your hands. If you do want to place upside bets just watch 222$ area for break as that could be a warning sign.


$BA now retest $220?...Got the morning pop I was looking for, took profits, thinking we need to retest $220 now. Going to wait and watch...

BA - Looks to Breakout Above Descending ChannelBA is currently in a well-established descending channel that's part of an underlying uptrend. And it seems ready to breakout past the channel's resistance. It is worth noting that BA has experienced similar descending channels twice before and price resolved higher and continued upwards both times. In this case we should be looking to enter long right after a breakout and hold until price faces a notable level of resistance - taking a conservative standpoint, I think this resistance will occur at the $257 level. Place your stops right below entry, if former resistance doesn't turn into support, the trade premise will be invalidated.
Considering that omicron has peaked in many countries and as border restrictions ease around the world, we could see another bullish period for travel. Technicals of other travel stocks also look quite strong while health care stocks look weak(er). We could see bulls take control of the travel sector in the coming weeks.

$BA - Flirting with a Breakout$BA is currently flirting with a breakout to the top of the channel.
Fakeouts in this name are common, I wouldn't be shocked if we rejected.
Will take calls on a confirmed breakout, puts is we reject towards the bottom of the channel.

BA - SELL strategyWe have been moving up steadily and now the DC is showing some likely top area. The stochastics are still positive and MACD is well.
We have good support $ 205, but feel judging the DC top and also the next resistance level, we may see this as a SELL opportunity. The earnings will be released 26th January 2022.
For now SELL current $ 226-228 area for a move back to $ 210 > 205. Stop-loss I prefer to keep that at $236 for now.


Boeing - Get ready to sell and go short$8.25 is what Boeing is looking to move this week from Fridays closing price. I think the chart explains it all. No questions will be answered. I will let the emotional people fight amongst themselves but mark this post and come back in 8 months. You will see my posts are beyond accurate. Good luck. For the record, I started my short position at 226.50

$BA pivotWatching for reaction off double top and 1.0 st dev of pitchfork. Overextended beyond the 9ema daily. Puts if it fails to break 227 or below 221.24. Bullish engulfing hammer daily and displayed good relative strength and rvol on a downtrend day in the indices with ER runup Jan 26 and airlines ER this week and last week as a catalyst. Calls if it breaks 227 with volume.

Boeing looking to break out of downtrend channel. Keep on watch!
Look for Boeing next week to breakout of this channel or reverse back into channel. Time will tell, best of luck traders!
Give a thumbs up if you like this analysis! Comment down below your thoughts if you agree or want me to look at other stocks to analyze!

Question will BA break out or continue the downtrendBA is in a meaningful downtrend. However much has changed. First they may be finally able to go back into production and complete deliveries now that China has signed off.
Second the wildfire that is Omicron is expected to burn out quick. People are sick of the covid and want to travel.
what will happen next? 1 Breakout 2 resume downtrend
This deserves to be watched.
