Potential Top in CostcoCostco Wholesale has been quietly limping, and some traders may see downside risk in the big-box retailer.
The first pattern on today’s chart is the June low of $973.90. COST made lower highs while trying to hold that level but is now sliding below it. That may be viewed as a potentially bearish tr
1,475 ARS
5.35 T ARS
184.84 T ARS
About Costco Wholesale
Sector
Industry
CEO
Roland M. Vachris
Website
Headquarters
Issaquah
Founded
1983
ISIN
ARDEUT110863
FIGI
BBG000HF59G5
Costco Wholesale Corp. engages in the provision of operation of membership warehouses through wholly owned subsidiaries. It operates through the following geographical segments: United States, Canada, and Other International Operations. The company was founded by James D. Sinegal and Jeffrey H. Brotman in 1983 and is headquartered in Issaquah, WA.
Related stocks

Costco: Strong Membership Model Suggests Bullish Upside Current Price: $987.02
Direction: LONG
Targets:
- T1 = $1,016.00
- T2 = $1,032.00
Stop Levels:
- S1 = $957.00
- S2 = $940.00
**Wisdom of Professional Traders:**
This analysis synthesizes insights from thousands of professional traders and market experts, leveraging collective i

COST Daily Chart Analysis: Key Levels, and Price StructureCostco Wholesale Corporation (COST)
Historical Context and Trend Channel:
From September 2024 through early 2025, COST was observed trading within a well-defined upward channel (indicated by the grey shaded areas). This channel represented a consistent bullish trend during that period. Howeve

Costco is in the Wyckoff distribution phaseThis Week (July 8 - 11):
Support: The immediate floor is at $965. Below that, the low from the initial sell-off around $955 is critical.
Resistance: The 20-day moving average (that green line) at ~$992 is the first ceiling. If it gets frisky, look for sellers to appear at $1,030.
Next Month (July

Costco, finally.... greenNASDAQ:COST finally seems to be turning around
if it closes above the 21 EMA and 50 SMA on the daily, it can go back to ATHs
will initiate a position at 1000 and stop at 990/980 depending on size
current targets are 1020 & 1035

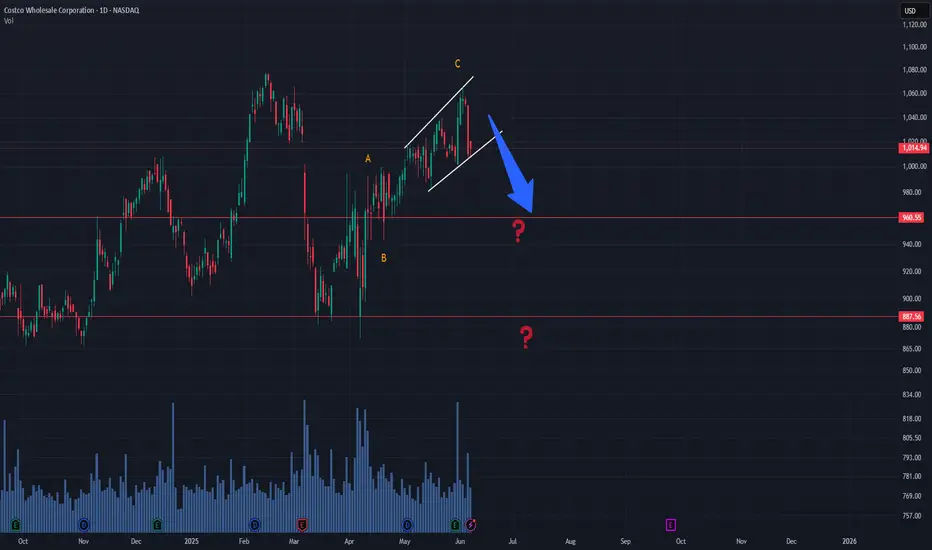
COST ABC Structure CompletedThe ABC correction may have completed, with the final C leg forming inside a diagonal structure. A sharp drop started from $1,066. Traders should wait for a potential corrective reaction before entering a short position.
It's important to note that as long as the diagonal channel remains intact, th
Costco Wave Analysis – 5 June 2025
- Costco reversed from the resistance zone
- Likely to fall to support level 985.00
Costco recently reversed down sharply from the resistance zone located between the key resistance 1080.00 (which stopped the previous impulse wave 5) and the upper weekly Bollinger Band.
The downward reversal from

COST Short – Double Top Rejection with Bearish CCI SignalNASDAQ:COST
📅 Entry: June 5, 2025
📉 Price: 1,055
✋ Stop: 1,078
🎯 Target: 1,013
⚖️ Risk-Reward: 1:2
✅ Status: Target hit earlier than expected
🧠 Trade Idea:
COST tested a major resistance zone at 1,078 — aligning with:
A historical horizontal resistance
The top boundary of a rising channel
Meanwhi

Costco (COST) Breakout Alert! Ready to Soar? Costco (COST) Breakout Alert! Ready to Soar?
Hey traders! Check out this bullish setup on Costco Wholesale (COST) . The stock just broke out above key resistance at $987.72 after a solid consolidation phase, with a clear target of $1,052.87 (+4.91% potential gain). The risk-reward ratio here is a

Costco readyNASDAQ:COST looks ready to move up to 1100
closed the gap from last earnings
bullish engulfing candle on the weekly and is breaking out of this 3 week range now
if it raises prices like NYSE:WMT did, might see a boost

See all ideas
Summarizing what the indicators are suggesting.
Oscillators
Neutral
SellBuy
Strong sellStrong buy
Strong sellSellNeutralBuyStrong buy
Oscillators
Neutral
SellBuy
Strong sellStrong buy
Strong sellSellNeutralBuyStrong buy
Summary
Neutral
SellBuy
Strong sellStrong buy
Strong sellSellNeutralBuyStrong buy
Summary
Neutral
SellBuy
Strong sellStrong buy
Strong sellSellNeutralBuyStrong buy
Summary
Neutral
SellBuy
Strong sellStrong buy
Strong sellSellNeutralBuyStrong buy
Moving Averages
Neutral
SellBuy
Strong sellStrong buy
Strong sellSellNeutralBuyStrong buy
Moving Averages
Neutral
SellBuy
Strong sellStrong buy
Strong sellSellNeutralBuyStrong buy
Displays a symbol's price movements over previous years to identify recurring trends.
COST4977644
Costco Wholesale Corporation 1.75% 20-APR-2032Yield to maturity
4.78%
Maturity date
Apr 20, 2032
COST4977643
Costco Wholesale Corporation 1.6% 20-APR-2030Yield to maturity
4.54%
Maturity date
Apr 20, 2030
COST4495548
Costco Wholesale Corporation 3.0% 18-MAY-2027Yield to maturity
4.00%
Maturity date
May 18, 2027
COST4977642
Costco Wholesale Corporation 1.375% 20-JUN-2027Yield to maturity
3.96%
Maturity date
Jun 20, 2027
See all COST bonds
Curated watchlists where COST is featured.
