costco analysis- signalI think this share will come down a little almost to 575 and the it will go up to around 645.
so you can open your buy position at 570-585 and your stop loss is 520 and tp being 640-650.
good luck
COST trade ideas

Alternative Bat/WThe bearish Alternative Bat should land close to the 1.113 fib level.
The last leg of a BAT should land around the .886.
The Bearish version looks like a crooked W and the Bullish version looks like a crooked M. In the bearish version, valley 2 is higher than valley 1.
The W was preceded by what appears to be a Bullish Cypher which should terminate close to the .786. Peak 2 is higher than peak 1 in both the Bullish Cypher and the Bullish Shark.
Steep rise on weekly so lots of buyers in this one.
Percentages listed are possible pull back targets and are percentages of the entire trend up from a low of 307. High is 612.27. 3 year low is 223.05.
Long term DMAs still in sync with an uptrend. The Alligator which is comprised on shorter term moving averages is just now trying to point down.
Many are very bullish on COST and short percent is very low and is less than 1%.
No recommendation. I am watching this one for a much deeper pull back.

COST weekly Wolfe Wave Bearish 4/21A Wolfe Wave is a chart pattern composed of five wave patterns in price that imply an underlying equilibrium price. Investors who use this system time their trades based upon the resistance and support lines indicated by the pattern.

COST bounce play or swing calls. Day traders and swing traders. Use this key lvl as a guidance to your money printer.

We are in for a pullback! 📉Hi there, Yurii Domaranskyi here.
Risk vs Reward = 1 to 5.1
It means if you risk here 100$ you may make 510$ Not bad, huh?

COST | GuidanceJournal Entry
Bias: Negative.
Sentiment: Pessimistic.
Emoji (emotion): Excited 🙃.
Null Hypothesis: Sell.
Alternative Hypothesis: Buy.
Signals: ...
Position: Day-swing trade.
Notes: ...
Barron's Company Overview: www.barrons.com
Other: ...
Tutorial: (Q/A) What exactly is the box labeled tolerance? The box labeled tolerance is a defined range of value & time that qualifies the right to exit the trade after a profit is made; as long as the security is inside the box and above the trade's entry one could say the profit is within tolerance, likewise if the security is outside the box either because of value or time one could say the profit is not within tolerance. It's a way to add parameters to the future outcome (as a means to grade the journal entry) while simultaneously providing leniency in the ability to achieve success with said journal entry.
About the Security: "Costco Wholesale Corp. engages in the operation of membership warehouses. The firm's product categories include food and sundries, hardlines, fresh foods, softlines, and ancillary. It operates through the following segments: United States Operations, Canadian Operations, and Other International Operations. The company was founded by James D. Sinegal and Jeffrey H. Brotman in 1983 and is headquartered in Issaquah, WA."
Social: I'm happy to hear from my readers/audience and I encourage constructive feedback; although I'm busy I will give my best effort to reply. I do strive to build an esteemed reputation and prolific following, I also strive to earn the title as a Tradingview Wizard and Top Author.
About the Author: I'm a financial scientist and my contributions offered to the community are apart of my scientific journal or goodwill to mankind. With that said I think it's prudent to make two things clear (1) I'm not a Wall Street retailer, I'm not trying to sell you products or services (2) I'm not a Wall Street advertiser, I'm not trying to market the purchase of securities to you.
Disclaimer: My journal entry is not a complete prospectus, please consider it accordingly.

COST 2/11/2022COST
COST enjoyed a nice continuation of uptrend from March 2021 thru Jan. 2022
Price sharply came crashing down from 560s to 470s.
Price bounce from 470s and looked like it was about to hang above moving averages and possibly make a move towards 570 again.
We had a false breakout from minor resistance at 522 and price the next day fell back under.
Price now is looking to close below 20ema which it was respecting. Que to enter trade
Entering trade short
Entry: 511.04
Stop Loss: 536.00
Target: 476.75 – RR ratio 1.37

cost updateam currently watching costco for a reaction from the upper channel line. if we get a price action reversal on a lower timeframe, i would look for sell trades from this area.

Costco looking toppishCostco has reached its upper channel and is in a parabolic move. Seems due for at least a pulback towards the bottom of its rising channel.

costco wholesale corporationtrade plan for costco wholesale corporation
"cost" short stock code for nazdaq

looking for a dip here COST at trend resistance / overbought rsi zone, looking for dip to trend resistance and maybe lower if that breaks.
targets 571.52-566.79-549.77

COSTCO - Looking very strongRefer chart mark up - looking very strong - in case if fall from here have strong area of support.
If you like try to accumulate from that area.
Let me know your thoughts.

Costco discounts at the store/pump, but not on the stock! xD holding above 1 important trend support, but also near strong resistance.
better to wait for confirmation move now, over 573.18 we can go long, below 547.37/trend support we can play the downside.

$COST with a Bullish outlook following its earnings #Stocks The PEAD projected a Bullish outlook for $COST after a Negative over reaction following its earnings release placing the stock in drift C with an expected accuracy of 71.43%.

$COST weekly update...Tested a run towards ATHs today, couldn't quite get there. If we can't retest and break, then there could be a solid pull back. Needs to hold strong here, sub $550 again and I think we pull to at least $525...

Eve & Adam Double Bottom confirmation on Costco ($COST)Earlier this month, Costco made confirmation of an Eve & Adam Double Bottom chart pattern as it began seeing daily closes above the mid range between lows. This pattern indicates a fairly high probability (about 88%) of a bullish reversal relative to the sell off which from the recent all-time high (571.49) achieved on December 29th, 2021.
Today, the price is within 10 points of the all-time high. I'll be looking over the coming weeks to see what happens next, and for possible positions. From here, I see one of two likely outcomes over the near term:
A) COST breaks out above the previous high and likely has a forcible move to the upside, or...
B) COST gets rejected from the current levels in the near term and has a pullback to somewhere around $520
In the case of A , I'll be looking to short either with a PUT spread, or potentially straight up long PUTs - which have a greater risk/reward but are enticing considering the macro picture of the broader market/economy as a whole. In the case of B , I'd shop for a long position with some kind of CALL spread.
The statistics indicate that track B has about a 2/3 chance of playing out. This could be even more advantageous because it could potentially offer both decent long and short opportunities over the next few months. We'll have to see where the chips fall.

cost formation.costco had a good earning report this week. i am watching this pattern form wld follow up keenly to see if costco gets to 549 area.
that would be a nice area for shorts and it completes the gartley pattern.
this setup might not be suitable for all parties. i prefer swings.

$COST Fakeout/Breakout Day 2...Just went red on the day, is this a repeat of the last attempt, or just volatility into FOMC?

$COST Cup Cheat Setup$COST cup cheat in a 2 and half month base.
50 MA in a clear downtrend (red) lowers the odd of the setup. That said, not many stocks looking as good as this one.
Worth watching.
COST bearish pattern and support testing.The value can go down from here as shown by the Gartley Bearish pattern. Buyers can book the profit at this point. Meanwhile there is support offered at the trendline and it would be interesting to see if the value is moved up again from 507 which could be a good buying opportunity.

$COST Breakout of fakeout...Been watching this develop, all stocks are waiting for rate hike confirmation tomorrow, then what. Does this break to the topside, or fall out of the wedge....

$COST last man standing?...Pull back to $470 maybe? Watching this closely, seems like it could be a weekly double top...

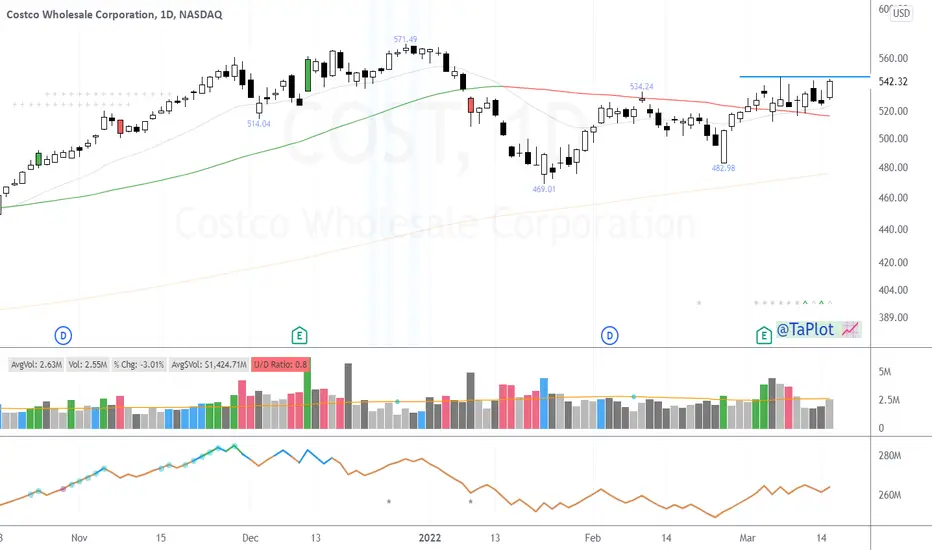
COST BEAR FLAGCOST has been chopping up and down in this clear bear flag trend.
It's only a matter of times before it revisits its lows imo.
See my "SPY DANGER" chart to see why I'm so bearish on stocks in the coming weeks. I explain everything in detail over there.
Looking for a break to the downside in the coming week and a half below the green support line.
Targets: 483 --> 470 (prior lows in February and January respectively). Below that.... well idc.
Play: COST 03/25/22 495/490p spreads at 0.5 at time of this writing. If ITM, these will go to 4.5 (9x).
I fully expect that to happen :)
NFA.
Don't go all in you chumps.
Good luck traders :)
