CVS Relief Rally on the wayShort sellers are exhausted after nearly 5 years of selling. CVS looks to be forming a W bottom at the 60 level, earnings have been steady and increasing for sometime making CVS a great value at this price, expect a 20-40% increase when shorts get squeezed in the coming weeks. My conservative target is in the 83, actual target is 95. Stop is a little under 60.
CVS trade ideas


#CVS i am long CVS ...price of CVS could double by year endRevenue and Income Net Revenues 2014 2015 2016 2017
139.4B 153.3B 177.5B 184.8B
CVS is making money ....business is BOOMING every year , they making more money every year .....this dip is a buying opportunity

CVS Looking Like a BuyBull wedge, good valuation, skirting the lower bollinger bands both near-term and long-term.

CVS cycle Buy $60, probably sell at $80 then maybe back to $60 before big rally. Very similar pattern as all other drops

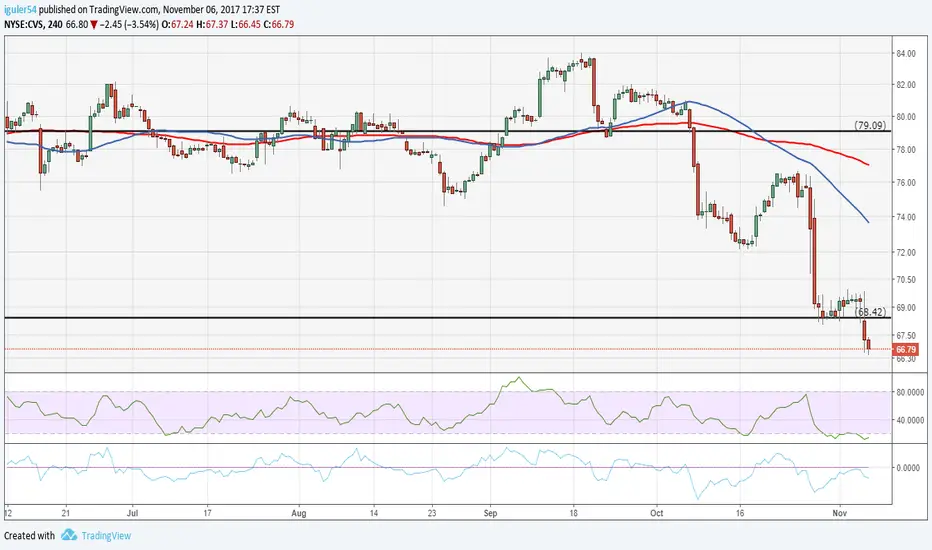
Dow drops once again #30 (CVS)Technical Concept: Support broken becomes Resistance (Red Arrows= Resistance) (Blue Arrows= Support)
I not use sophisticated Technical jargon in an attempt to persuade and impress the reader because I not a Charlatan
I do not use fancy Charts plenty of Indicators, Oscillators, and other stuff, all in a stock chart in an attempt to impress
the reader with my knowledge because I not a Tutor or Mentor.
I am not either a Business man, Engineer, Doctor, Inventor or Innovator; this requires different skills and personalities
Who I am?
I am End of Day Analyst and Stock Picker, I support myself in Charts, but I not self-proclaimed Technical Analyst Expert
I do not fall into the mistake of comparing and affirm that Technical Analysis is better than Fundamental Analysis .
I am a person without Higher Education, and not have Math Skills.
I am a right brain oriented person and I focus in my strengths, for this reason I use Charts and
I no try to become a Quantitative Trader, since it is a lost cause, in my case.
I dedicated 10 lonely years of deliberate practice and in this process, I eliminated all kind of thoughts.
I open and reset a lot of Demo Accounts for this purpose
I tried and practice with different Markets (Forex, Options and Stocks) with different Time Frames (Intraday, Scalping, Swing/Position).
I tried Mechanical Trading too, But definitely I am Discretionary Analyst or Qualitative, It took me years to know it, and a lot of books.
I've learned by myself, but I do not think I'm smarter than others, “Ego is a sin”
What I do?
I pick Stocks manually I watch one by one without the use of a Stock Screener
I follow approximately 1300 to 1400 Stocks , with different market cap
I have no preference for a particular industry I follow 10 Industries even Public Utilities
I do not follow Penny Stocks and Over-The-Counter stocks
I not follow Stocks with an Avg_Volume bellow 100,000 with (Low Liquidity)
I use a simple method based in Support and Resistance , accompanied with moving averages, and I do a Top down Analysis with multiple time frames
My first view of a Stock is a 10 year Weekly Chart, Then I do a zoom in and I focus in the action of the last 2 or 4 Years, I look my Daily Chart and 4-Hrs Chart too
I understand the concept of Short Selling and spend hours searching this kind of patterns including the weekends.
What I can do for you?
I can put ideas in the desk of Professional Traders, the ideas are based in Price Patterns + Price Action,
and they can trade with your own system or set up
My ideas are not influenced by the media or my neighbors,
This was my Resume and Cover letter
Sincerely
Alex_Quiroga


Valor intrínseco CVSCompañía medica, valor intrínseco calculado a partir de crecimiento en ventas, manejo de deuda, potencial de crecimiento futuro y comparación con otras compañías del sector.

Gaining MomentumHi guys. I meekly think this is a good potential for a long entry here with CVS; however, I would wait for a small dip. Good luck my friends.


CVS, waiting for the breakoutThe stock is moving in a sideways parallel channel started at the beginning of 2017. This movement can be a redistribution or an accumulation phase, it depends if it breaks lower or higher. If the price breaks lower the minimum target is around 70 and if it breaks higher the minimum target is around 88. The breakout must be confirmed by very high volume to avoid fakeouts or pullbacks.
The informations and the strategies discussed are NOT recommendation to buy, sell or trade any securities. They are strictly for educational and illustrative purposes.


Bought CVS near day highsLike CVS corp culture; debt to equity, low beta. Everything seems pricey now but there might be some short term upside here.


CVS set up for a couple of nice opportunities!So CVS looks to be in a pretty nice channel and trading pretty nicely inside it. I think two things could happen. 1, it could breakout of the channel in which I would buy in after the retest or 2, it could trade back down to support which I would buy at a really nice discount. Two entries on the chart, lets see what happens. It could also keep trading in this channel which wouldnt be all that bad because some serious pressure would be building up for a pretty nice pop bearish or bullish. Lets keep an eye on this one!
