DAL bearish reversal + bounce12/30/17
Bearish reversal
Enter with a close at $56 resistance, stop above the high at $57 and lock in profits at $52 support. R=500, $1.26 stop gap, 198 shares, 12-day trade.
Then buy low, sell high :)
DAL trade ideas

DAL longDAL has been heading up, and I think it might go farther. If it looks like a bounce is due on the latest resistance-turned-support then I'll buy around $56, stop at $55 and sell at $58. I only expect the trade to take 3-4 days.
On the flip side, a short position could work in the opposite scenario.


Delta Airlines #DAL weekly demand imbalance, long biasNew weekly demand level a round 50 for long term longs on Delta Airlines #DAL american stock. Previous weekly demand zones at 48.50 and 45.15 have played out nicely. Long term long bias at weekly and daily demand imbalances

Delta breakout possible on technicals and valuation Cheap multiple for the best performing airline. Ascending wedge favors the possibility of a breakout with minimal downside risk. Solid balance sheet minimizes the macro risk of oil continuing to rise. TVC:USOIL

homework :indicator SMAThe benefit of the SMA indicator is its visual simplicity. Traders can quickly assess the prevailing trend of price behavior from the direction of the SMA.


October 11 Earnings: Delta Airlines - Fuel, Fuel, FuelAll major airlines have enjoyed solid financial upbeat since Oil $USOIL has remained under $50/barrel.
Delta Airlines has subsequently hiked their dividend throughout the quarter and increased share buybacks.
The company is also committed to paying down debt while financial conditions allow for it.
The ITIA's latest data reports a Load Factor of 84.7% - Optimistic readings for airlines.
Traffic growth remains high at 6.8% as more people take to the skies and shipping increases.
I believe this quarter will be bullish for airlines following the summer season.
I'm starting Delta Airlines with a $55.00 PT for the post-earnings price action.


Retested & Good Price Action & Elliott Wave to buyElliott Wave, Price Action, Parallel Channel, Supply and Demand, Cup and Handle


7.30.17 | DAL | Falling Wedge BreakoutDAL just like AAL looks like it is ready to breakout out bullish from a falling wedge. Price is oversold on Stochastic's and the Sentiment Zone with the RVGI crossing over bullish. The first target is on the 31.8% line at about $51.97 which should be hit by Thursday or Friday. Use your 8 EMA or daily volatility to place your stop.

Double Bottom for DALDAL present a double bottom pattern with a support on 44 and the Stoch RSI Indicate that the stock is oversold zone, waiting for a touch on the support level , we might can see a bounce back above Fib. Levels


Perfect dance on trendline from DALDelta just jumped off perfectly on the trendline. Volume raised and now there is a reason for me to go long.
PT: 54-56.


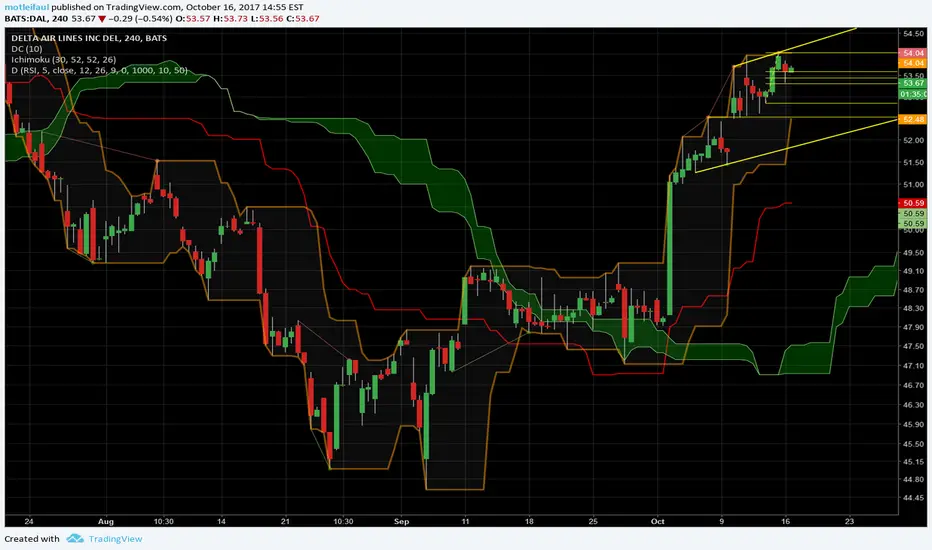
Fly eagles fly $DAL $UAL $LUVI'm still tracking the airlines with a big smile despite a vicious retest of "range breakouts" that occurred last month. Delta is my chart favorite. This is less of a range breakout and more of a slow grind up. Currently showing some nice divergence on the hourly near long term resistance. I only buy on strength so I will wait for a SOLID higher low/higher high.
The options are trading tight and deep - aka good spreads and great open interest/volume across many months and strikes. The implied volatility is low, so the options are relatively cheap. Since this stock is grinding higher slowly, I am happy to buy time when the IV is so low,

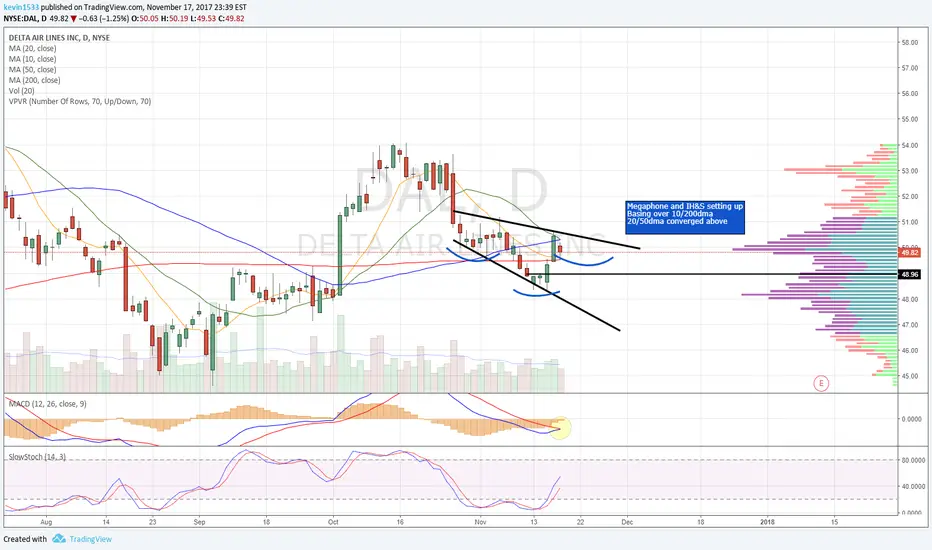
DALDoji candle today sitting at the support area hopefully starts to see green tomorrow. But Wait for confirmation before going long.
