DALD trade ideas

Delta calendar spread strangle ideaDelta airlines has stayed in an upward trend channel the past 4 months. Today it peeked out above it at $43.67. I saw this as a good entry for a DAL$42-45calendarSpreadStrangle12/11-12/18. This gives me a week to profit the price action on the put side and 2 weeks to profit the price action on the call side. The reason I spread the expiry dates like this is because DAL was at the extreme 4 month trend channel high so I'm anticipating sooner movement on the downside and later movement on the upside. Either way I'm covered for the future price action with risk management. The only potential losing part of this trade is the theta, time decay, that's why I entered a strangle at an extreme point in DAL chart pattern expecting movement. Do your own due diligence, your risk is 100% your responsibility. You win some or you learn some. Consider being charitable with some of your profit to help humankind. Small incremental steps work : If you double a penny for a month it = $5,368,709. Good luck and happy trading friends...
*3x lucky 7s of trading 101*
7pt Trading compass:
Price action, entry/exit
Volume average/direction
Trend, patterns, momentum
Newsworthy current events
Revenue & Earnings
Debt / Cash
Book value, assets
7 Common mistakes:
+5% portfolio trades, risk management
Beware of analysts motives
Emotions & Opinions
FOMO : bad timing
Lack of planning & discipline
Forgetting restraint
Obdurate repetitive errors
7 Important tools:
Trading View app!, Brokerage UI
Accurate indicators & settings
Wide screen monitor/s
Trading log (pencil & graph paper)
Big organized desk
Reading books, playing chess
Sorted watch-list
Checkout my indicators:
Fibonacci VIP - volume
Fibonacci MA7 - price
pi RSI - trend momentum
www.tradingview.com
www.tradingview.com


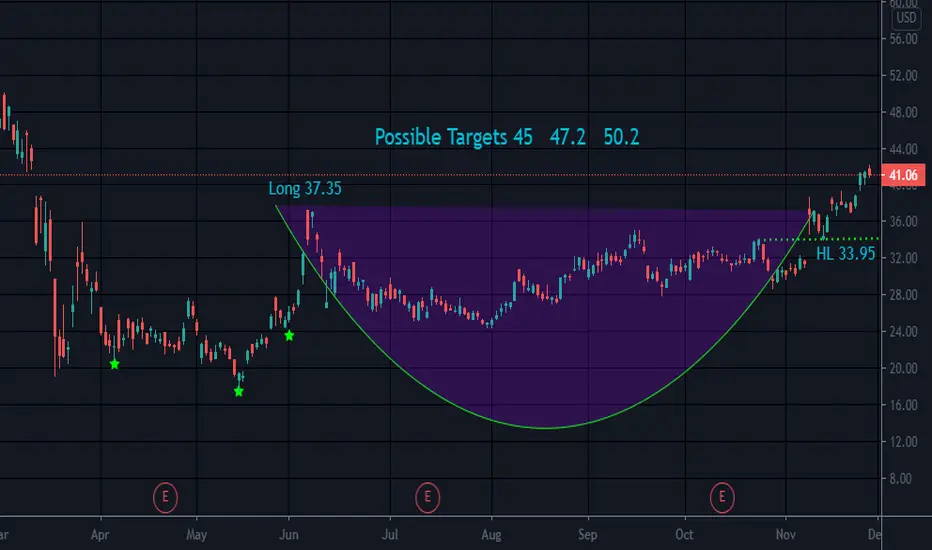
Cup and Handle Inverse Head and ShouldersDAL also formed an inverted H&S with neckline at 35.9..
Possible long term targets/T2 59.2 65.5..
Head and shoulder bottoms or Inverse H&S, can have more than one head and more than 2 shoulders, but rarely both. The bottoms can be rounded (Eve) or spikey (Adam) or a mixture of both.. This reversal pattern (reversal of a downtrend as there has to be a prior trend to reverse) is usually reliable although any pattern can fail..
The psychology of an inverse H&S is a supply vs demand scenario or a tug of war between the bulls and the bears. The bears take price down forming the left shoulder, but the bulls come to the rescue, taking price back up. The bears fight back and this go around, the bears take it even lower, forming the head. The bulls are not giving up yet and come back in force sending price up once again only to have the bears rain on the their party. And once again the bulls take price up. When price goes down to form the right shoulder, the bulls are ready and waiting to take price back up once again. By now the bears are worn out, they throw in the towel and go hibernate for a while and price is free to go higher after crossing the resistance of the neckline.
Not a recommendation
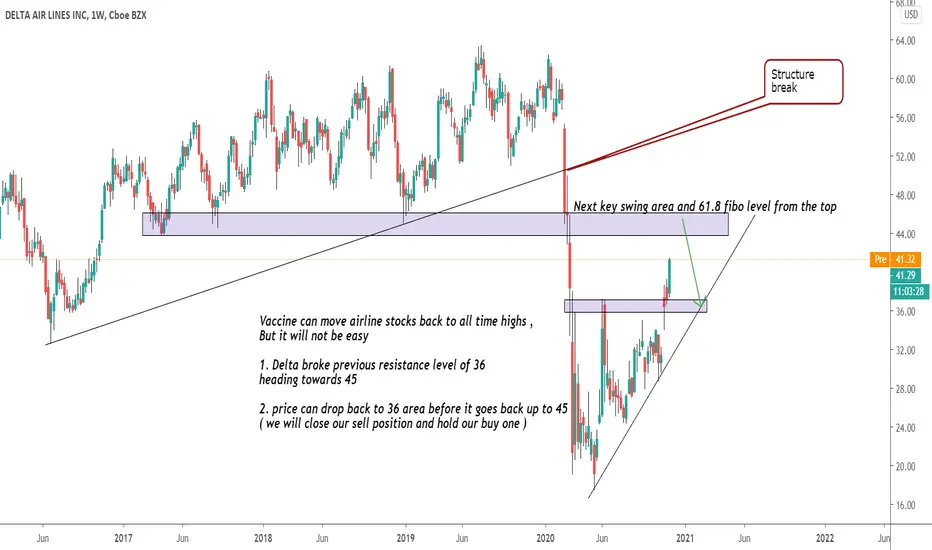
$DAL Delta Airlines set for Take off
DAL is one of the most bullish setups among the Travel & leisure stocks.
Downtrend Broken.
Golden cross on Moving averages (50 crosses above the 200).
Broken above dead cat bounce Fibonacci level 0.382.
Targets
-$38.78 Gap fill open
-$39.98 0.5 Fibonacci retracement
-$41.73 Gap fill close
-$45.29 Major resistance at Fibonacci Golden pocket


Inverse Head and ShouldersLong entry (LE) is when price breaks the resistance of the neckline with a strong uptrend
Possible T2 59.2 to 65.6
Possible stop below 30.10
Monday travel stocks gapped up. Seems most are filling their gaps and have pulled back
Just an observation
Often easier to look through the rearview mirror than the front windhield (o:

DAL IS COMING BACKA big breakout and retest from trend line. Expected to go higher in the next few months.

$DAL$DAL Made a Cup & Handle Pattern and symmetrical triangle breakout both in the daily and weekly chart.


eh theres better optionsDAL be careful here. we all know they are making no money right now and laying off. the chart shows it. for now id focus more on puts if the bottom trendline breaks. if you are long DONT do calls. add shares with a tight stoploss. leave a like if you found this helpful <3

DAL - Elliottwave analysis - Swing set up - Bear caseDAL - It is in Y wave down within WXY correction down. The X wave was triangle and seems its over, but it will confirm, once price break down below 27.89 level. It is a sell set up at current level with stop level above 34.02 for target below 28 or even lower. It is under performing the SPX, which is added benefit to the trade set up. As alternate count, it can extend the E wave in further triangle, so if price doesn't fall soon then there will be extension within correction, so stay small initially in trade and add more after confirming down cycle.
Give thumbs up if you really like the trade idea.

Delta Air lines Inc. LONG📈 NYSE:DAL LONG H4
🛒BUY above = 31.43
🎯Target1 = 32.54
🎯Target2 = 33.23
🛑Trailing Stop loss = 29.62
❌Cancel trade and open reverse trade = 29.62
🙈Recommended risk = 1-2%

DAL TradeWatching DAL for a day or two.
Looking at the chart in yellow, loos to be a bull flag.
Target is the green line, while the red is a stop point.
Cases for:
Selling pressure is decreasing. The volume for selling is less than the buying.
Each attempt to go below 30.12 we see a bounce.
RSI volume is going upward.
Cases against:
UK and Europe going into lockdown.
uncertainty due to election.
Enter: 30.60-30.80
Target: 31.25.
Stop: 29.75
best of luck,
--d0x

Bears are up now Yesterday , delta airlines had broken out of penent to take a bearish move , also macd is on overbought level crossing over 80 which is a beautiful confirmation , get ready bears 🤟🏻

$DAL wedge breakdownTicker: $DAL Daily Chart
- $DAL not looking too hot here... we have been forming a symmetrical wedge since back in February, ultimately breaking it to he downside
- Should we take out the swing low of 28, watch for 24. If not we will retest the wedge breakout level

Strong supportWe are getting strong support at 31.6 - 32 level which could result in atleast 50% retracement to the last move downward . Lower pink horizontal line is of 50% retracement level amd upper is for 63% retracement level according to gann's retracement rule


$DAL Delta Airlines. Bumpy ride, but trend since May is in tactFor those with a longer term view. Long.

Delta Bearish outlook after disappointing Earnings$DAL is currently trading on the lower boundary of the projected PEAD cone with the latter predicting a bearish outlook for the coming period.

DELTA AIR LINES INC. LONG📈 NYSE:DAL LONG H4
🛒BUY above = 33.30
🎯Target1 = 34.80
🎯Target2 = 35.70
🛑Stop loss or cancel trade = 30.90
🙈Recommended risk = (2%-3%)

$DAL Delta Airlines Pre Earnings Analysis
Potential Long entry on the back of earnings tomorrow if
commentary is any way encouraging.
Major resistance sits at $34.67-
-Fibonacci .382 level
-200 Moving Average
-Sloping Downtrend
Alert set for $35.00 .
This could be a massive week for the airlines and BA
