My Analysis for DELTA AIR LINES INC, a Bullish move is startingHi Traders, I'm sharing with you my vision concerning DELTA AIR LINES INC, the downtrend has come to an end, now place for a big uptrend move , It's the start of a bullish big move , waiting for your comments and remarks guys, good luck for you all :)
DALD trade ideas


Delta Airline - Technical AnalysisDelta Airline - The idea is to go long.
Wait if there will be a price return/retracement up to the trendline before buying

Delta Airlines key level on $24Delta is a buy.
Price action suggests not only having bottomed, but is already recovering.
As long as $24 holds, Delta is a buy.

Dal LongI see a buy trend here on this stock, but there is down side risk as well. Lots of posibilities to recover but i don´t know which way heading for.

DAL: Potential Short Term Bullish Reversal 1M, 1D (Jun. 01)X Force Global Analysis:
In this analysis, we take a purely technical approach to Delta Airlines (DAL), exploring signs of the stock being oversold, as well as potentially bullish reversal signals demonstrated on the monthly and daily charts.
Monthly Chart
- On the monthly chart, we have counted clear Elliott Waves
- Since 2015, Delta Airlines has been forming a bearish rising wedge pattern
- Moreover, we could spot an extended bearish divergence, with prices forming higher highs, while the indicators formed lower highs
- The Relative Strength Index (RSI) formed lower highs, as well as the Moving Averages in the Moving Average Convergence Divergence (MACD)
- Within the bearish ascending wedge, we could count Elliott Triangle Waves (ABCDE), leading to a breakdown triggered by the Corona Virus (Covid-19)
- Currently, technicals demonstrate that the stock is oversold, and under extended.
- The RSI demonstrates that DAL is at oversold regions
- The MACD shows historical bearish histograms
- However, despite the huge bearish pressure, we can also see signs of a short term potential reversal through candlestick patterns
- The current candle is forming a dragonfly doji candle, in which we see a long lower tail, and a small upper tail, with the candle close close to the open value
- Combining this with Elliott Waves, it could be said that we are in a downtrend counting Elliott Impulse waves (12345)
- This dragonfly doji candle could be the start of a short term trend reversal for wave 4
- While we have failed to break and close above the 0.618 Fibonacci retracement support, it's important to note that we have secured a historical support at $22.45
Daily Chart
- When we zoom into the daily chart, we see clearer signs of a short term bullish reversal
- We have been consolidating within a bullish descending wedge pattern after a severe drop
- Prices have broken out of the falling wedge, as we are seeing a small pullback
- We can also spot a clear bullish divergence, with lower lows on the price, and higher lows on the indicators
- The RSI demonstrates great strength, trading at neutral levels
- The MACD also shows that the trend is backed by momentum, as it creates a steady uptrend without any death crosses
- We can spot a lot of gaps ranging from $20 up to $56
- Despite the high trading volume, the current range starting from the drop was extremely choppy
What We Believe
Combining the evidence suggested in the daily chart with the analysis of the monthly chart, a probable case would be a further rally up filling the upper gaps at $30 ranges, completing wave 4 on the monthly. From that point, we could see further correction, filling the gaps located below the current price, before we see a mid-term trend reversal leading to a bullish rally to fill the gaps above. While it's important to also take into consideration the fact that Delta Airline's fundamentals have also been heavily affected by Covid-19, technical demonstrate a high probability for a short term bullish trend reversal.
Trade Safe.

Short from down trend and risk off for stocks acc. trade warShort from down trend and risk off for stocks acc. trade war

Delta bounce or breakdown at $24?I dont know where this is going yet but I think it will be interesting to watch how Delta moves around the $24 area. Might be some good weekly options bets lining up here for anyone trading this stock.


Wyckoff MethodDelta has been undervalued since they haven't been able to perform as per usual. It may be a while before they continue business as usual. They will be able to bounce back as one of the Domestic Airlines. I am more interested in Domestic since other countries may want to keep a hold on the spread of the Virus by preventing international flights.
Overall this is the BOTTOM considering they have been cutting flights by 95% this is literally their minimum capacity. There is only up from here. Not only that but a familiar pattern has risen to rear its head. Wyckoff method. If it is the Wyckoff method it will test that first line again by the end of next week.
Even if it doesn't I still think this is a good buy signal. Delta is in a great position to grow from here so long as there isn't a second wave of breakouts with the virus.

$Dal - profit taking is near?RSI over 72 (bearish)
MACD: Repeating pattern from April 29
SMI Rolling over at 1 month highs
Would not be surprised if it dropped back into the lower gap or bounce off of it before testing upper gap.
I don see a lot of reward for airlines at this level. Will most likely wait for entry in the 30's.

America’s #1 Airline - Delta LongLadies and gentlemen please stay in your seats until we reach 20,000 feet 😄

Delta Airline - Technical AnalysisThe breakout of the top trendline and the stochastic might suggest a buy signal (Check France -KML Airlines , Ryanair , - all European company that have opened high, as well as LSE:IAG .
Perhaps, Delta will do the same.


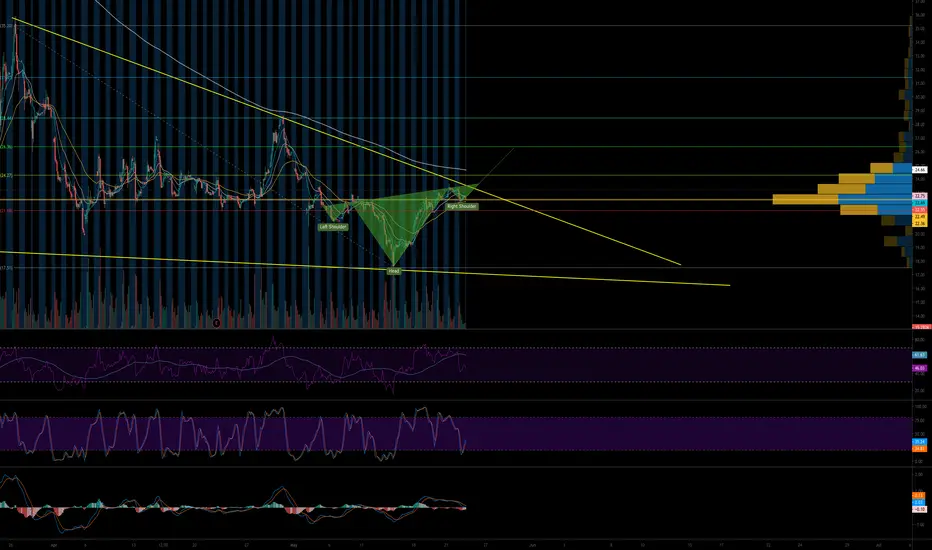
DAL - Swing to $26The right shoulder on the reverse H&S may have bottomed. It's important to note that the neckline is tilted on the upside, so I'm giving the bullish case extra weight. There's the 200 in the way and a trend line since the initial recovery, but with states easing, I think we can see it bump to $26 in the short term. Like I said, however, lots of things in the way so exercise patience and wait for confirmation because we're still in a bearish trend overall.
Same story then rise into elections...tehre is no way trumpo is going to lose this battle to terrible joe
Follow
Follow
Follow

Nearing Speculative Buy PointAirlines have been dumbstruck by this health crisis and many have lost all the stock gains since the financial crisis. That being said... we are still going to use airplanes right? Maybe they'll need to update health and safety procedures and spend a little more money on cleaning the planes, but we don't really have another feasible option for long distance travel, SOO... Future Demand exists.
The descending wedge pattern we've been in since mid-March may be a reversal pattern. I would not recommend entering a long trade until we get confirmation of a reversal on the shorter time frame and a daily break out of this wedge pattern.

Delta Air Lines Inc Bargain BuyHello friends, followers, and traders,
Delta airlines have announced that this coming June customers will see the return of several major routes, both U.S. domestic and international, which were previously suspended due to the COVID-19 pandemic.
As we approach June I suspect there is going to be a burst in price action across several markets as a direct result of borders opening. What we can expect in the following months; CFDs will climb, however, the need for hedging funds will decrease as people return to work and play. I believe this will negatively impact precious metals along with BTC and cryptocurrencies.
Here on this chart, you can see that I have plotted a course of action for the price. We may not see a correction here on the 4-hour timeframe giving the fact that Delta is sitting at a bargain buy yet at the same time Delta technically is due for a correction which is why I have included this on the chart.
The next move up is the .618% Fibonacci level, aka a benchmark for a standard retracement but also noted, what was support now turned resistance. We can expect some kind of strong reaction to this area and will most likely see a minor correction after being rejected by this resistance area.
Delta Update
Good Luck
Cheers!

DAL is on Historical Key Level! Welcome to Profitlio Trading!
What's up traders! Thanks for Jumping back on my Analysis, Traderchamp is here on your Service, Also hit thumbs up and support the work.
DAL showing a historical key level and where price held very strong from COVID19 crashes. Expecting to be a good turning point at this level. Sketch up your own trade setup and make sure you meet with the required confirmations first before you make your move!
⭕️ ✅ Scroll Down 👇 ⬇️ to signature section for 📲 contact details 💰💰💰
Profitlio Trading ( Since 2014 in Financial Markets )
________________________________________________
Traders Disclaimer: Non of our analysis or trade setups being shared here on tradingview is a trading advice. As we keep on weekly updates with our predictions and expectations. We may take them as a trade only if trade setup meets the required criteria ( Confirmations ). Unless we will never take them as a trade if it never reach our trading requirements.
Take them at your own risk as trading is highly risky and you may loss your investments. Our trades are based on Swinging and Mid to long term approaches. All trades executed will be handled under the name of Profitlio Trading only.

DALweekly chart :
W have a good support here , for gradual consolidation , target is between 50-62 Fibonacci .
best luck .
