Delta Air Lines-DAL -Daily -Trend Trading with RgMov & CCITREND TRADING WITH RGMOV AND CCI
1. BUYS = Watch for RgMov to make a 2-month high, then buy CCI readings of -100 followed by trading above, then closing above a previous day's high. Exit at 3 ATR rally or when CCI reaches +100 adding each 1 ATR advance. Stop = 3 ATR's OR if RgMov makes a 2-month low on a closing basis (2 months = 44 days)
2. SELLS = Watch for RgMov to make a 2-month low, then sell CCI readings of +100 followed by trading below, then closing below a previous day's low. Exit at 3 ATR decline OR when CCI reaches -100, adding each 1 ATR decline. Stop = 3 ATR's OR if RgMov makes a 2-month high on a closing basis (2 months = 44 days)
There are plenty of other exit strategies - including using a trailing stop once the CCI has reached the opposite extreme. A simple trailing stop can be over/under the 3-day range.
Tim 1:12PM EST, March 6, 2015
DALD trade ideas


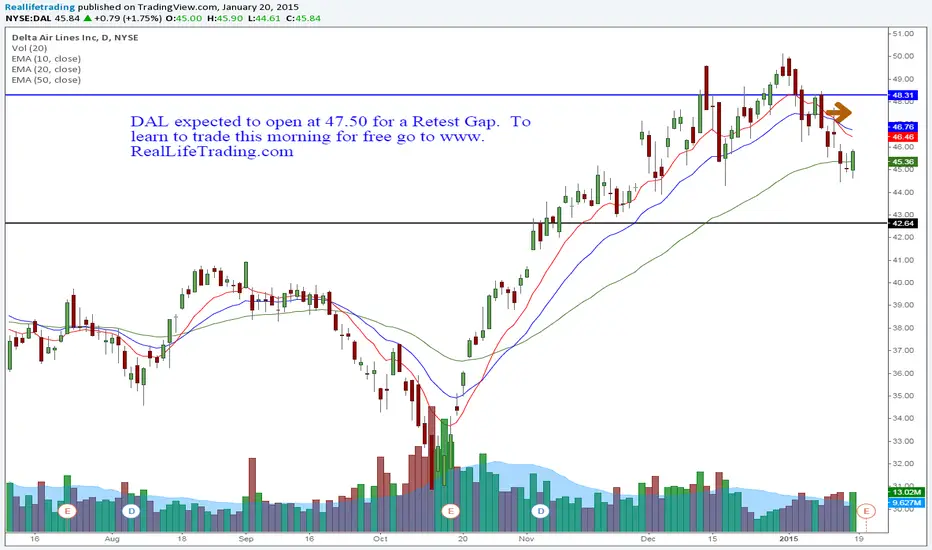
DAL Day Trade Retest Gap (Brad Reed Jan20,2015)DAL expected to open at 47.50 for a Retest Gap. To learn to trade this morning for free go to www.RealLifeTrading.com
DAL- The Most Fundamentally Sound Airline DAL is hands down my favorite airline stock. I can't justify executing a long position here as the risk is to great for me right here. I'm a buyer at 42, I'm a thief at 38. But with oil plummeting, it wouldn't surprise me to see DAL hit 55 before pulling back any significant amount. DAL sits atop of my watchlist

Dark Cloud makes Delta cleared for landing.Dark cloud candlestick pattern occurring at the extreme of the Bollinger Bands with momentum divergence showing on both the mac-d histogram and RSI. Looking for price to retrace to the 50 ema or lower Bollinger Band, whichever occurs first.

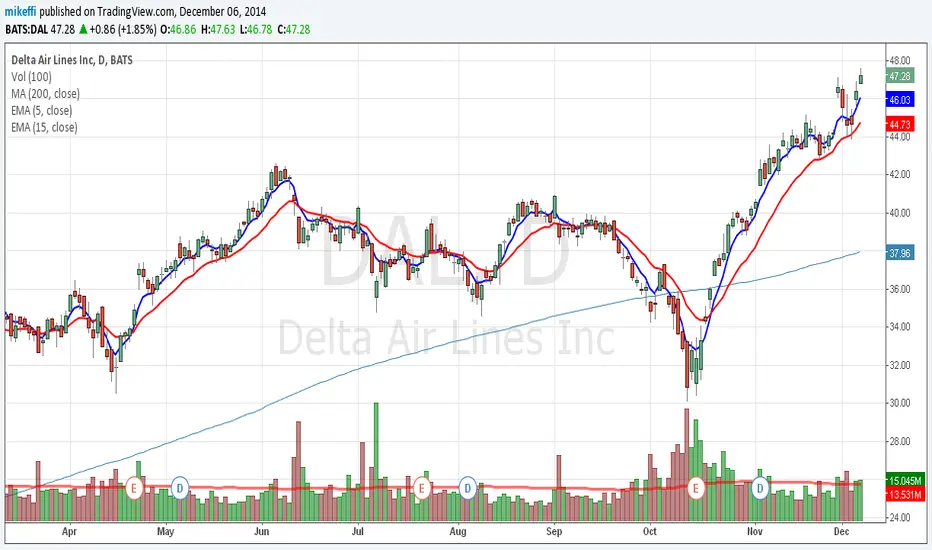
DAL bullish flag above previous resistanceDAL had been a great trending stock for a couple of years but the 2014 correction was extremely deep (by the standards of this stock).
More recently the June 2014 high was broken but price remained fairly indecisive just above it for a few weeks. Staying above the previous resistance, however, is far superior to dipping below, so this was the first suggestion that the uptrend could resume. The breakout on 28th November did not hold, followed by another on 5th December which also resulted in a small pullback.
Yesterday's bar was far more convincing - a larger, bullish candle on higher volume confirmed the flag formation. But with the $50 half-figure approaching I will hold off on DAL for now (plus I'm already in LUV, another airline).

DAL continue to fly highercontinuation of uptrend after retracement early last week. high trading volume associated with new price peak, suggestive of further upside potential. suit covered call or bull put spread
Airlines selling off to April levels.Troubling to see Airlines selling off , even before the Ebola news. Crude oil plummeting didn't seem to help.

Delta Air Lines -DAL- Daily - Showing relative weakness, sellLately DAL hasn't kept pace with the advance in the SPY, leaving me to wonder where all the table-pounding buyers have gone? I feel like a broken clock on DAL, constantly calling for a top in the chart, but once again the chart shows that something is wrong or that at the least there are sellers liquidating their positions as the price languishes relative to the S&P500.
Tim 38.04 last 12:33PM EST 9/22/2014

Delta Air Lines -DAL -Daily - Stalling out after a 4-fold rallyNote how the last "key level" keeps getting tested - maybe it will trigger some stops and lead to a more cascading-type of decline.
I hope my artwork wasn't too inappropriate!
Tim
Friday, September 19, 2014 4:21PM EST - Quad-Witching Expiration Today!

DAL Long - Consolidating Flag (Bull); Risk:Reward > 10:1The idea here isn't very difficult to understand. DAL has made a run up from $35.51 on August 8th, where we saw a bounce off the 150EMA, a personal favorite area to get long for me, especially looking at the weekly chart for this. Anyways, from the top down:
1) Bullish RSI Holding 60 Support
2) Established Uptrend - Long Term
3) Bounce off 150 EMA
4) Long $4.46 move straight up through all EMA(8/21/50), through resistance, and consolidating above.
5) Broken Downtrend
6)Weekly Uptrend Is Beautiful - Right At EMAs (8/21)
(My Screen Is Too Small To Pull Up Both Simultaneously)
Cons:
1) MACD Is Positive
2) Momentum Tapering As We Consolidate
I like the chart, and like what I see. I'm getting long here. Possibly with a covered call, but maybe something else. Not sure what other plays are available with such low volatility, but the verticals and diagonals are getting old.

DAL Long - Bull Flag ConsolidationThe idea here isn't very difficult to understand. DAL has made a run up from $35.51 on August 8th, where we saw a bounce off the 150EMA, a personal favorite area to get long for me, especially looking at the weekly chart for this. Anyways, from the top down:
1) Bullish RSI Holding 60 Support
2) Established Uptrend - Long Term
3) Bounce off 150 EMA
4) Long $4.46 move straight up through all EMA(8/21/50), through resistance, and consolidating above.
5) Broken Downtrend
6)Weekly Uptrend Is Beautiful - Right At EMAs (8/21)
(My Screen Is Too Small To Pull Up Both Simultaneously)
Cons:
1) MACD Is Positive
2) Momentum Tapering As We Consolidate
I like the chart, and like what I see. I'm getting long here. Possibly with a covered call, but maybe something else. Not sure what other plays are available with such low volatility, but the verticals and diagonals are getting old.

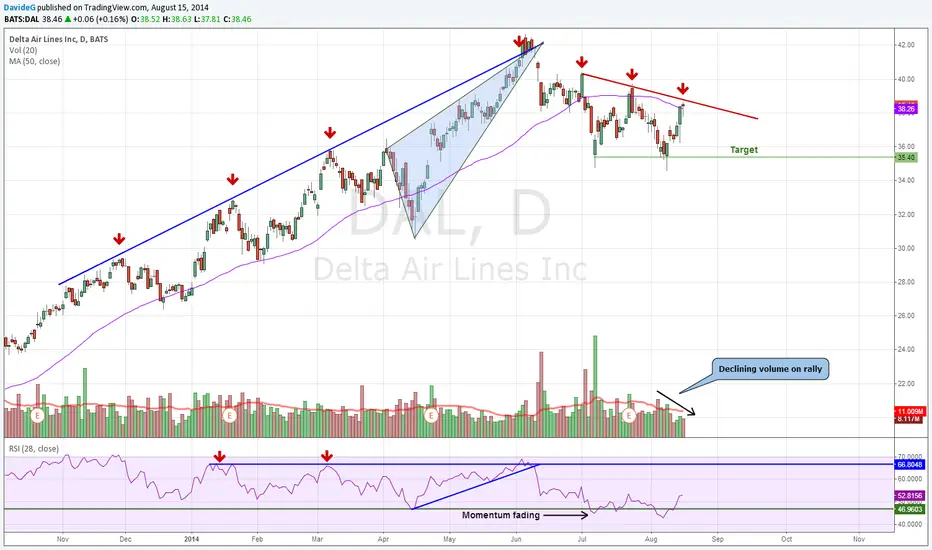
DAL - Bumping into Significant ResistanceRepublishing older chart, with a few new annotations. Re-shorting DAL here at $38.54 - exactly where I covered in late June. Bumping up against the 50 SMA, which has been a significant support level since Nov 2012. Long-term momentum broken, with the RSI dipping below the 48 level in early July for the first time in more than a year and a half. Targeting $35.4, with sights on further downside.
8.15.14 - 3:14pm EST
Dela Airlines - Double bottom at valueThe weekly chart of Delta stands at value The volume during this decline is a warning signal, but we have to keep in mind Iraq and Oil price fluctuations.
The daily has a double bottom with a divergence, my favorite signal. Due to the big gap up, the risk reward isn't that great, so personally I'm not going to take this trade, but I thought I should publish it anyway, cause I like Delta. Weis Wave shows huge effort, little reward, another bullish signal.

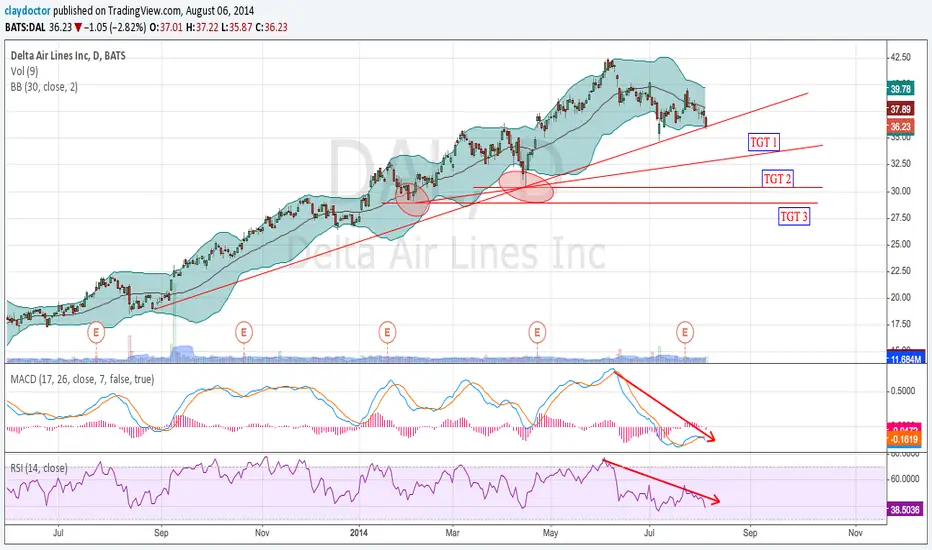
Delta Airlines - DAL - Downtrend - Failing at Key Hidden SupportNotice how well DAL acts around the "key hidden levels" from earnings release. I highlighted in red circles where there were many key trade setups on a retracement to the green lines, which I call "key hidden levels".
What I see happening here is DAL is potentially failing to hold key support at 35.80 that has been tested twice already in the July selloff: first on a major gap down (where I had suggested to cover shorts) and again two days later. DAL looks ready to move lower to 32 where I see it taking several attempts to bounce off of it.
I view risk as a stop at $37 and a re-short at $38.40 strong resistance. Look to cover at $32.50-$32 over the course of August. Note that Gambling stocks are moving lower and airline stocks often follow Gambling stocks, with a lag.
Tim 11:23PM EST 8/7/2014 35.61 last DAL
***Subscribe to "KEY HIDDEN LEVELS" in the "indicators: marketplace add-ons" window to have the earnings triangles and support/resistance lines plot automatically.

DAL normally I would say bounce ahead, but, there's PUTINPutin, enough said, wont back down, will take Ukraine, planned all along, flights suspended over eastern Russia, what's next? Transports suffer either way until this whole thing settles down. Russia takes Ukraine, the world media yells NOT FAIR, US and Europe do nothing but paper tiger - throws spit balls his way, Russia restores order, the world goes back to business, until the next annexation by Russia, who is next?

Delta Airlines - Abandoned babyThis candle pattern is called an abandoned baby. Price usually recoils from it, and today's gap was a confirmation. Even if the correction will extend in the overall market, with such a rare pattern I'm very confident that Delta will rally in the coming days/weeks.
weekly here :

Delta Airlines - DAL - Daily - Top formation - Trend DownVolatility the last 2 days in DAL makes it look risky to short DAL here, but the "range movement" made a two-month low. We can wait for an overbought reading to sell short OR sell short some here and some on a little rally.
Leave some to sell short on a decline under the current lows AFTER a bounce.
Looking for 10% to 15% down in DAL.
Tim 38.17 -2.14 last
FWIW - I haven't been all that accurate in DAL - but maybe I am due.

Delta Airlines - Corrective double bottomI see this pattern way too many times in different
financial instruments, but no one ever gave it a name.
It is one of the best patterns in the system I use, it might
actually be the best. I call it a corrective double bottom
because it is a double bottom after a small correction
in an uptrend. Price usually soars after a pattern like this, the
double bottom acts like a launching deck.
I have observed that the opposite, that being a double top
after a small rally in a downtrend doesn't have the same accuracy,
but this thought has no testing behind it, it's just an opinion.
You can see that at 38$ price formed a double bottom, after a very fast correction because of the tensions in Iraq, more specific the increase in oil prices because terrorists seized control of different raffineries in the country. Price retested this level, and went a bit below the previous swing low (that being stop hunting) as you can see in the 4H chart. The two FIs show bullish divergence, and MACD histogram is rising. This is a very usual pattern for Delta. At a point it is going to fail, but until then, it gets the benefit of the doubt. First target at 42.50$, but usually price goes way over the last swing high, look back if you're not convinced. Also, check out my previous chart on Delta, where I outlined previous patterns.
The four hour chart looks even better, and explains better why I think Delta is going to rise

DAL completing an ABCD patternPrice of oil spike, DAL completing an ABCD pattern, where suspect Bollinger band and bottom trend line of channel meet and have lunch. But where they have lunch depends on who is picking up the tab, the US in Baghdad, or Iran in Kuwait? If the US does not prevent the spread of ISIS through Baghdad, which not sure if Iran or the US really cares about that, neither Iran nor US will let them get that far South where the real oil is and the export terminal. The question is the timing of it all, and how high the price of oil gets before one or the other steps in to calm the sees and take control. Problem is, if the US in ineffective, and Iran takes control at any point, they are Shiite brothers of the current Iraq government, price of oil continues to rise, because US will be vulnerable to Iran at that point for that oil, not good.
