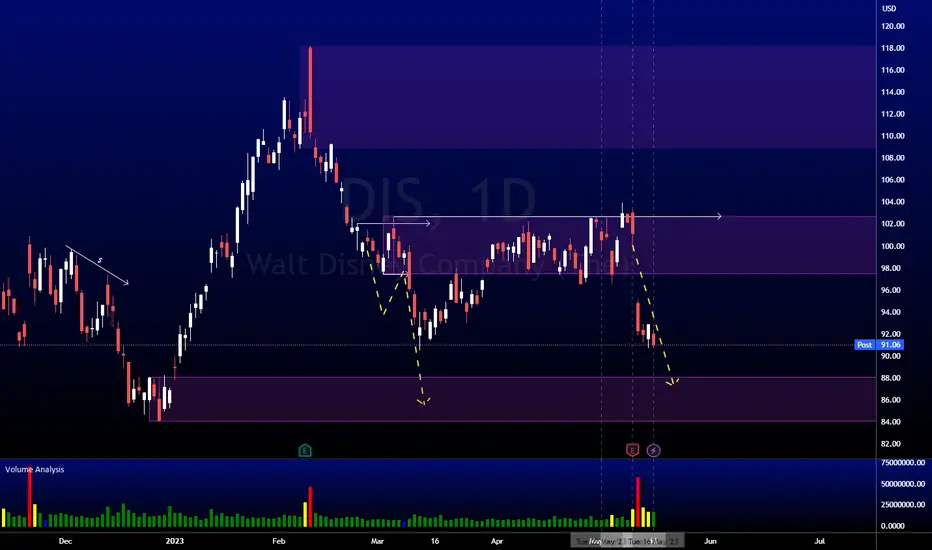
DIS AnalysisPrice played nicely as analyzed last week giving us a 10% move to the downside. No changes to my expectations, I'm expecting price to continue lower into the bullish POI at 88.07.
DISND trade ideas
Is DISNEY Ahead of the PackLooking at Disneys percentage pullbacks, the most recent downtrend was over 70%, which tells me its most aggressive downward
price action could have already played out. It could get much worse or have a period of sideways action. After looking at shorter
time frames it kind of made me reconsider how much downside was still in store for it. It'll be interesting to see how things play out.
I still think the Debt Ceiling situation could be a catalyst.

DIS does not look very goodBirds eye view of Disney's red flags.
Yet another corporation gets a swirly in the public toilet by woke insanity leadership. Like the rest they endure a public lashing on social media,
they cry for Argentina and then enact a public relations dream job. An orgy of pseudo-viral internet hype, resurrected leadership nostalgia for
the stock holders and good ol' fashioned base-demographic pandering. In Disneys case and actually the same for any company that follows
this form of "Hail Mary" Redemptive Marketing Protocol... it is a whole lot of planning and talking and a whole lot of packing, to ultimately go
nowhere at all. After watching one after the other of these corporations go through this process of self-destruction, it makes me wonder
if we are witnessing a "controlled demolition" of sorts. The repo market situation right before The Pandemic, The Money Printers Going Brrrrrr,
The "Transitory" Inflation Period, The Fed Rate Hikes, The Regional Banking Crisis and The Final Hurrah, just around the corner, possibly
culminating in The Debt Ceiling Crisis and The United States Defaulting. I don't know and its hard to say but I cannot think of one person
who truly has their finger on the pulse of this market and that is probably because we are not getting all of the information, which would
fill in some of the blind spots out there right now and the reality of things would probably be painfully obvious, rather than whatever you
want to call the the market since the first of the year. These are just some thoughts I have been having and the only narrative I can piece
together in order to explain what we've been witnessing recently. It is not in my nature to be such a Bear but if I am honest with myself, I
cannot help but see major Red Flags in practically every single chart. If things play out in any way close to what I am seeing, we are in for
lost decade and the end of things as we know them.

DISNEY - DIS is not what Disney needs right nowYet another corporation gets a swirly in the public toilet by woke insanity leadership. Like the rest they endure a public lashing on social media,
they cry for Argentina and then enact a public relations dream job. An orgy of pseudo-viral internet hype, resurrected leadership nostalgia for
the stock holders and good ol' fashioned base-demographic pandering. In Disneys case and actually the same for any company that follows
this form of "Hail Mary" Redemptive Marketing Protocol... it is a whole lot of planning and talking and a whole lot of packing, to ultimately go
nowhere at all. After watching one after the other of these corporations go through this process of self-destruction, it makes me wonder
if we are witnessing a "controlled demolition" of sorts. The repo market situation right before The Pandemic, The Money Printers Going Brrrrrr,
The "Transitory" Inflation Period, The Fed Rate Hikes, The Regional Banking Crisis and The Final Hurrah, just around the corner, possibly
culminating in The Debt Ceiling Crisis and The United States Defaulting. I don't know and its hard to say but I cannot think of one person
who truly has their finger on the pulse of this market and that is probably because we are not getting all of the information, which would
fill in some of the blind spots out there right now and the reality of things would probably be painfully obvious, rather than whatever you
want to call the the market since the first of the year. These are just some thoughts I have been having and the only narrative I can piece
together in order to explain what we've been witnessing recently. It is not in my nature to be such a Bear but if I am honest with myself, I
cannot help but see major Red Flags in practically every single chart. If things play out in any way close to what I am seeing, we are in for
lost decade and the end of things as we know them.

Disney - strong results in spite of audience dipDisney reported mixed results for the quarter. The good: streaming losses fell to $659M from the previous quarter’s $1.1B, whereas streaming revenues rose +12% to $5.5B. Crucially ARPU (average revenue per user) rose 20%in the US and ~6% internationally — it’s a case of squeezing actual profit out of users rather than scaling the business at all costs — this is the new “raison d’etre” of streamers globally, as heralded by WBD CEO Zaslav a few quarters ago — like in Jerry Maguire, “show me the money”.
And now for the bad: total users fell to 157M from 161M — this was mostly due to Disney+Hotstar, an Indian subscription service — it was mostly an outlier; users lost ex Hotstar sat in the hundreds of thousands.
The ugly: linear (“trad”) TV revenues fell 7%, largely due to the increased cost of sports rights and declining advertising revenues. We’ve seen this across the board – WBD and Paramount saw the same.
See upside here as +$130 and downside as +$80 for the year. Read more at: research.blackbull.com

The Fake Gap Vs. The Real GapAre you interested in trading stocks?
then keep reading
--
The problem with the gap strategy
is that you can not know if a gap is real or fake
so if you trade based on just looking at the then you
--
will lose
--
This is why you need to pay attention to
these 3 things
--
1-Make sure the gap is a real gap
2-Make sure the price is moving in a trend
3-Make sure it happens near the end of the week
--
If you use this strategy without my guidance
you will lose
--
Watch this video to find out what a fake gap
is and the one stock which fake gapped
from
Lubosi forex

Sitting at 9 year supportBuying June calls here…. too much conviction to only buy shares.
Who is selling at 9 year lows?

$DISNYSE:DIS
Bullish above 96.50 (TGT 97, 97.50, 97.89)CS (98.27)S2 Retrace 4 EMA
Bearish below 95 (TGT 94.50, 94.24)DP ( 93.50, 93, 91.85)S4 (88.64)S5
(DP 98.95)475k (94.24)650k (96.35)1 mil)

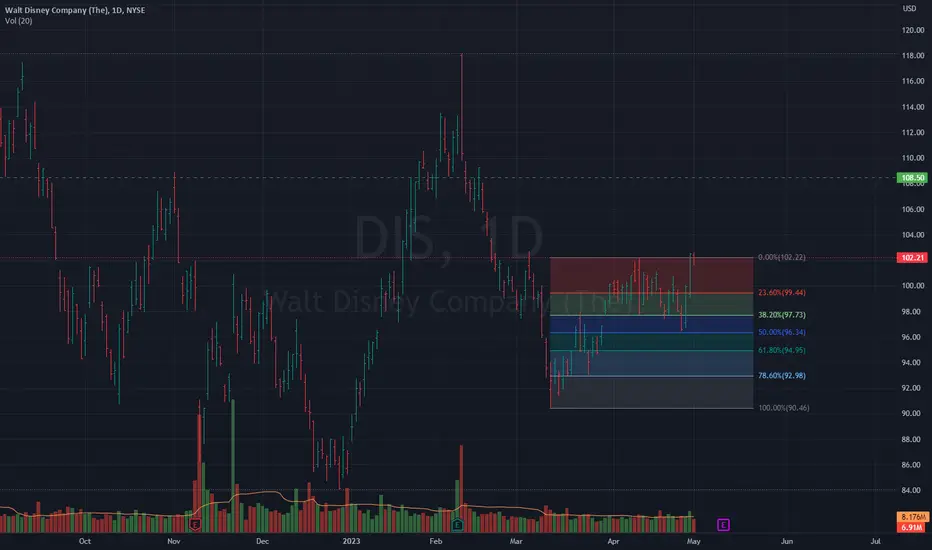
$DIS - Over reaction to ERNYSE:DIS #DIS Ouch! ER destroyed the setup. I think its an over reaction on a company pivoting for streaming profitability. $92-$90 is an important support area for the bulls. If that breaks, downside risk is $80. If the $92-$90 support hold, it can get back to $100 in a short time.
DIS Disney Options Ahead of EarningsIf you haven`t bought DIS Disney calls here:
Then analyzing the options chain of DIS Disney prior to the earnings report this week,
I would consider purchasing the 95usd strike price Puts with
an expiration date of 2023-9-15,
for a premium of approximately $4.20.
If these options prove to be profitable prior to the earnings release, I would sell at least half of them.
Looking forward to read your opinion about it.

DIS AnalysisPrice took liquidity above 102.70 and is unable to close above. Earnings also causes price to break market structure to the downside. I'm expecting a continuation downside, potentially to the bullish POI at 88.07.

A Breakthrough Resistance, Earnings on the HorizonNYSE:DIS Disney ( NYSE:DIS ), a leading name in global entertainment, recently broke through a significant resistance level at 103.58, showing potential for further upside. With a soon-to-be-released earnings report and strong fundamental performance, the stage seems set for an exciting play.
Technical Outlook:
Disney's stock price broke through a key resistance level at 103.58 on May 8th then shortly fell after. This shift suggests a possible bullish sentiment in the market. Coupled with the upcoming earnings report, this breakthrough could act as a catalyst for a retest of this level and potentially push the price towards the next target level at 106.25.
Fundamental Performance:
Disney's financial performance shows encouraging signs. The Earnings Per Share (EPS) has grown by 36.60% YoY to $1.82, a positive indication despite it being lower than the 2018 figure. The Book Value Per Share and Sales Per Share have also grown YoY, suggesting an increase in the company's underlying assets and revenue growth.
The company's profitability ratios have improved, with an increase in Return on Equity (ROE), Return on Assets (ROA), Gross Profit Margin, Operating Profit Margin, and Net Profit Margin. These figures suggest improved cost management, operational efficiency, and overall profitability.
Disney's activity ratios show an increase in Total Asset Turnover and Inventory Turnover, indicating more efficient use of assets and inventory management.
In terms of financial health, Disney has reduced its Long-term Debt to Capital ratio and Financial Leverage, suggesting a decrease in risk as the company has become less reliant on external liabilities.
Valuation and Growth:
Disney's current P/E ratio is higher than its 5-year average, which might suggest overvaluation, while its lower Price/Book Value ratio could indicate potential undervaluation based on net assets. A comparison with industry averages would provide a more comprehensive perspective.
The company has shown positive revenue growth. However, the EPS growth rate is negative on a 5-year average, indicating some earnings instability.
Conclusion:
Disney's stock presents a compelling opportunity, with the recent technical breakout and robust fundamentals. Investors, however, should consider the mixed growth rates and valuation signals. As always, thorough research and possibly consultation with a financial advisor are recommended before making any investment decisions.

$DIS - bull and bear thesisNYSE:DIS
Weekly timeframe
* Based on the wicks the past 5 weeks, this is setting up for a move back to around $113
Bull: Above $100, back to $113
Bear: Weekly close below $99, back to $90

4 LESSONS from Disney as a trader and Upside to comeI’m well in my thirties and Disney is still just as magical to me as it was when I was a kid.
When I was 15, one of the happiest days of my life was walking into Disney world.
The excitement lead to jumping, screaming and so much excitement not knowing where to start!
Anyways, Disney has been an icon in the entertainment industry for decades.
And they have delivered and shared unique and magical experiences and captivating stories to you, me and everyone around the world.
It’s definitely on my bucket list to go back to Disney world again. But today, I want to share some of the Disney’s principles can be applied to trading the financial markets and help traders develop a successful and profitable strategy.
Diversification with Disney versus Financial Markets:
Disney has a diverse portfolio of theme parks, resorts, hotels, products, services and franchises.
As traders we really need to open our options and diversify our portfolios in all different markets and instruments.
If you rely on ONE market or one country, you will not be able to spread and limit the risk during tumultuous times.
Just as Disney has a wide range of offerings to appeal to different audiences, us as traders should have a variety of investments to suit our personal trading style and risk tolerance.
Strong Brands applies to both
Disney has built a reputation as a trusted and reliable brand, and traders can learn from this by creating a watchlist of markets and securities that align with their trading strategy.
When you see the famous logo, the magical characters, princesses, cute animals – we just know it’s Disney.
When we here the Wish upon a star song or see Tinkerbell – we know.
As traders we need to also focus on the strongest brands.
Blue chip companies from shares.
Highest liquid (volume) traded currencies, indices, commodities.
Most reliable, legit, regulated and trustworthy exchanges.
High demand, volume traded and strong crypto currencies with promising prospects
Low costs, fees, conditions with trading instruments (i.e. Spread Trading and CFDs).
Stay innovative and you’ll have the edge!
Disney has always been at the forefront of innovation.
Whether it’s through its cutting-edge rides, products, restaurants, or even its Disney Plus TV streaming service.
Similarly, traders should strive to stay ahead of the curve by using the latest technology and tools to trade the markets.
This could include using advanced charting software, automated trading systems, or utilizing machine learning algorithms to analyze data.
TradingView is one of the only charting platforms that I have seen innovate on a weekly basis!
By embracing innovation, traders can stay ahead of the competition and stay ahead of market trends.
Staying True to Disney staying True to YOU!
At its core, Disney is all about staying true to its unique style and storytelling.
As I mentioned earlier. You can just tell it’s Disney.
Traders can learn from this by developing their own trading personality and risk profile, and sticking to it no matter what the market conditions may be.
Just as Disney has remained true to its vision for decades, traders should stay true to their own trading strategy, even in the face of market volatility and uncertainty.
You can now see how Disney’s timeless principles apply their success and how we can learn from them as traders to optimise, improve and level up our own financial success.
And on that note, Disney is also heading up!
Cup and Handle has shown, price has broken above.
We can see the first target at least - showing strong momentum to come.
But more on that next time!

DIS Entry, Volume, Target, StopEnter @ any price between 102.00 - 102.56
With above average volume
Target: 108.50 area
Depending on your risk tolerance: 100.58 gets you 3/1 Risk/Reward
This trade idea is not trade advice. This idea is strictly based on my ideas and technical analysis. Not due diligence or fundamental analysis was performed while evaluating this trade idea. Do not take this trade based on my idea, do not follow anyone blindly, do your own analysis and due diligence. I am not a professional trader.
$DIS - Looking good $102 has been hard to breakSince the pull back from last ER, NYSE:DIS has been unable to break above $102.00. Its area of 200DMA. If $102.00 breaks, we can see $113.00. On the other hand, if things goes south we can see $98-$96 area.
-----
Not an investment advice.

DIS AnalysisPrice created equal highs at 102.70, building buy-side liquidity. With the current bullish momentum, I'm expecting price to continue higher into the bearish POI at 118.18, following the current bullish order flow.

Reversal signal. MACD Buy. Break Resistance1. Reversal signal.
2. MACD Buy.
3. Break Resistance.
4. TAYOR & Good Luck.

DISNEY for freetmhere i show a bit of what i think disney can do monday 5/1, showing volume profile and vpocs

DIS - Breakout Falling Trend Channel- DIS has broken through the ceiling of a falling trend channel in the medium long term.
- This indicates a slower falling rate initially, or the start of a more horizontal development.
- An inverse head and shoulders formation is under development.
- A decisive break of the resistance at 119, ideally with an increase in volume, signals a further rise.
- The stock has broken up through resistance at 100.
- Overall assessed as technically positive for the medium long term.
*EP: Enter Price, SL: Support, TP: Take Profit, CL: Cut Loss, TF: Time Frame, RST: Resistance, RTS: Resistance to be Support LT TP: Long Term Target Price
*Chart Pattern:
DT - Double Top | BEARISH | RED
DB - Double Bottom | BULLISH | GREEN
HNS - Head & Shoulder | BEARISH | RED
REC - Rectangle | BLUE
iHNS - inverse head & Shoulder | BULLISH | GREEN
Verify it first and believe later.
WavePoint ❤️

Disney Inverse Head and Shoulders Intact (Bullish) Weekly close over both the 20 and 50 MAs to close out the month.
Conservative Cup Height: $ 21
Implied Price Target: $ 130

ABC/DEarnings May 10th AMC.
Targets may depend on earnings release and appear some analysts are negative.
Stop under C. Target is D.
Appears to be consolidating which often leads to a break up or a break down in the near future.
No recommendation.
52 Week Range
84.07
126.48
Day Range
96.71
99.78
EPS (FWD)
4.17
PE (FWD)
23.16
Div Rate (TTM)
-
Yield (TTM)
-
Short Interest
1.05%
Market Cap
$176.49B
Volume
4,864,911

DIS at an interesting junctureConsolidating for the last few weeks in an increasingly tight range between the weekly 20 (yellow) and 50 (green) moving averages.
Bullish on an upside break and flip of the 50 as support
Bearish on a break of the 20 and retest as new resistance.
Note this is all occurring in a weekly timeframe inverse head and shoulders . I am inclined to lean in to a bullish bias.
No position yet but I'll be looking to start a swing trading position at the 20 weekly moving average (low to mid 98s) this week with a stop loss at 97.
Position to be posted upon entry.
Have a great week.
