DocuI hopped on a trade of DOCU today of an ascending triangle breakout. I wasn’t able to post it bexusse I was really watching my trade. Target is 162$. We are entering a correction here I’m watching closely at this level of 152 to hold as support. If we lost it we might need to cme
Back to 150 or 145 for a double bottom Howver the daily is so over sold and we have a long swing up to retest the previous support as new potential resiatnce all the way up at 189. We could swing the next bounce back up to those ranges. It’s pretty clear we found resiatnce at 155 and so far holdinf suppprt 152.29. So watch these levels as a trading range to break one way or the other I’m bettin on the upside and have 160$ calls a few weeks out
DOCU trade ideas

DOCU Dump or Pump from the bottom?There is a daily wolfe wave setup in DOCU that has not yet triggered a buy entry. The setup appeared after the earnings debacle and we believe alot of people lost tremendous amounts of money using DOCU as a covid play. The projected target is calculated by extending a linear line between pivot 1 and 4 and projecting the line. This is represented as the green perforated line, as shown in the chart. The projected target is approximately 300;however, note the wolfe wave apex is diverging instead of converging into an apex. The expected time frame for this trade idea unknown, however, using leaps 2024 OTM contracts is something to think about if you want to remove any short term uncertainty.

$DOCU HIGH VOLUME MONDAY!-ARKK several reports of buying multiple shares at this dip good for a long term dip buy or a quick scalp on Monday
-Will be watching volatility closely and Implied volatility on these options.
-Mainly just looking to profit off the hype on Monday looks like it had found its bottom here

4 Chart Patterns to Watch ForRally Base Rally
Rally Base Drop
Drop Base Drop
Drop Base Rally
Work on all time frames
Provides entries
Gives stops
Decreases risk

DOCUSIGN, Wave 4th Wave?Docusign could've made or still making a Wave 4 . It seems to me that we had and extended 3rd Wave until 300 $. However right now we cannot be sure if the movement to the downside is finished. It might come down to test that 50% Fib. Retracement , even the upper trendline. I wouldn't buy just yet but I would keep a closer look at price action. If moving up, resistance might be found around 186 $.

DocuSign Inc. and the lesson to be learnt. (TL;DR at end)When the Covid pandemic began affecting many people throughout the workplace and in their homes, companies such as NASDAQ:MSFT , Zoom and NASDAQ:GOOGL began rapidly designing software to accommodate for this very new sprouting market that nobody had ever seen before. A whole line of business dedicated to allowing people to perform their work assigned tasks from anywhere in the world or from the comfort of their couch at home. Despite the major sell-off due to the pandemic and fears of complete economic collapse in some places, a number of people and companies became considerably wealthier. A prime example that I am writing about today is DocuSign and their virtual document signing services which are in competition with NASDAQ:ADBE .
There was a massive craze over this whole digital work idea and many investors believed it was a "money-pot" for a future dominating market. Many investors began pumping money into such companies for long and short term investments. The thought behind it being, "people prefer working this way and now that they have used it, they'll never go back". This mentality obviously allowed companies like DocuSign to advance in price dramatically, because how else are you supposed to sign off a document on a desktop for instance. Despite the thought process seeming "sound", there was one major downfall.
The anticipated growth for a company like DocuSign and other competitors was astronomical. But, as Covid restrictions began to ease up slightly between the time of the announcement of the Delta variant and then Omicron, many people realised that they didn't quite enjoy working from home and/or owners of companies brought many employees back into the workplace, sales for products provided by a company like DocuSign slipped and this sent shivers through countless investors' spines as they realised how overpriced the company may have actually been in comparison to its inherent value. Needless to mention, DocuSign announcing that the "pandemic boom" in business was slowing down after they presented their slipping sales did not help in any which way, shape, nor form. This resulted in a horrific sell-off of countless stocks causing price a catastrophic price drop (especially for traders) of around $100 in Docusign and major price drops with their competitors. Consequently, Adobe had a stock price drop too as investors lost faith in their ability to maintain growth in sales (From $698 all the way through to $616 (at the time of writing)).
Now there is one major lesson to be learnt regarding this scenario and like so many before it. Deciding to become a shareholder in a company due to the potential in their industry and their presence within it alone can end horrifically. Especially when the media "hypes up" such companies resulting in horrific over-evaluations. One must perform their own investigation into the safety of such company regardless of how long you plan on holding their stock for. There is no point in putting money into a company that may not be profitable or the management consists of a number of incompetent monkeys for instance just because everybody is talking about it. You must perform your own investigation and create your own judgement on whether this company is actually worth your time. As an investor or trader, you must be careful, now as much as ever. There are countless startups having their prices floated by the media and the public's attitude towards the company which inevitably come crashing back down, even though all that could be avoided if the investor/trader actually held back until they deemed the price "acceptable or attractive" for the company.
As always, further opinions, facts and news that I may not be aware of are always welcome in the comments, it is always good to bounce ideas off of others, so comment away!
TL;DR: The work from home craze at the beginning of the pandemic ('hyped' by the media) caused many to pump money into companies that would later lose business as many returned to the workplace or their financial infrastructure was realised to be dysfunctional. One must do their own homework into companies and only pay a suitable price for the stock they're getting.

Who Would You Stake?Hey everyone! 👋
This month, in preperation for the new year, we will be theming our posts around the concept of building a solid trading plan!
Later posts in December will look at the key elements involved in building a rock-solid game plan, but today, to introduce the concepts in a fun way, we will be looking at a completely hypothetical situation.
-
Let’s say that you’re walking down the street, and a stranger approaches you with a business proposal; he’s recently sold his business, and come into a significant amount of capital - $10,000,000. Additionally, word of the sale has gotten to two separate aspiring traders, who have approached him asking him if they can manage his money in return for a fee.
The stranger has heard from a family friend that you’re interested in trading, and he wants your help in picking out which trader to invest the money in. In return for your help, He’s going to split the profits he makes 50-50 with you.
Obviously, it’s in your best interest to help him make a decision that will make the most money for the longest period of time, with the least amount of risk.
The stranger then pulls out contact information for both traders, and asks you to interview them separately.
-
Here's our question to you: if you only get to ask the traders three questions to gauge their likely future performance, what would you ask them? What questions dive to the heart of risk, reward, and sustainability?
We look forward to your replies, and in next week's post, we will begin looking at how some of the likely responses can go towards building out a consistent, profitable process!
- Team TradingView

$DOCU Holy #$%@!Wow, I can comprehend how this can drop 42% in one day. Sorry Cathie...Be careful out there,


$DOCUWatching $docu for an entry - seems a collision with 200 day on the daily chart is inevitable. Interested in what it does afterwards. Possible squeeze along support into a bull flag...also fits nicely into vol profile support and fib levels. Or perhaps a continuation within this channel...that means breaking the 200d and further downside...? A break above that channel seems like a more obvious entry point.
NASDAQ:DOCU

DOCU (1W) Midterm free fall incoming ? Pure speculation ;) Hi Traders,
Premarket 23% drop looks quite interesting. If something like this will occur, we can create a HUGE gap which should be filled in the futue.
Take this chart with a big amount of salt. Its pure speculation for mid-term downtrend because Impulsive wave of the price action is not 100% clear. What is clear, you can see a Bearish divergence of RSI and MACD what is not good sign.
Take care, trade safe and mary f@kin christmas ;)


DOCU Premarket DumpDOCU with the premarket dump that has occurred has found its place sitting on the 4.618 fib circle line
Price from here will likely have a sharp recovery, back to the major trend line
Opportunity to grab these on the cheap

DocuSign falling more than 30%DocuSign's price plummeted more than 30%, after publishing Q3 results. Docu posted beter than expected Q3 results, but the CEO said that the pandemic boom appears to dissipate. The company’s billings and revenue forecast missed expectations. Right now the price is back to 2020 June levels..

$DOCU with a big gap down after earnings...There is a weekly closing gap at 161.42 and below there is 150.60. If there is more bearish price action, these could be targeted by sellers.


Beautiful rejectionif you can read a chart this looks lovely...
Multiple confluence on the weekly chart here

DocuSign buy zoneDocuSign is currently sitting in a great buy zone, with a lot of volume and potential to shoot the price upward !
Potential gains 10-15% in upcoming days

DOCU potential grpwth to 300-320Touched a demand zone, where we could see potential reversal.
Entry price - 278
Stop-loss - 274
Target Price - 300-320
Size - 5% of the capital
Period 4-6 weeks.

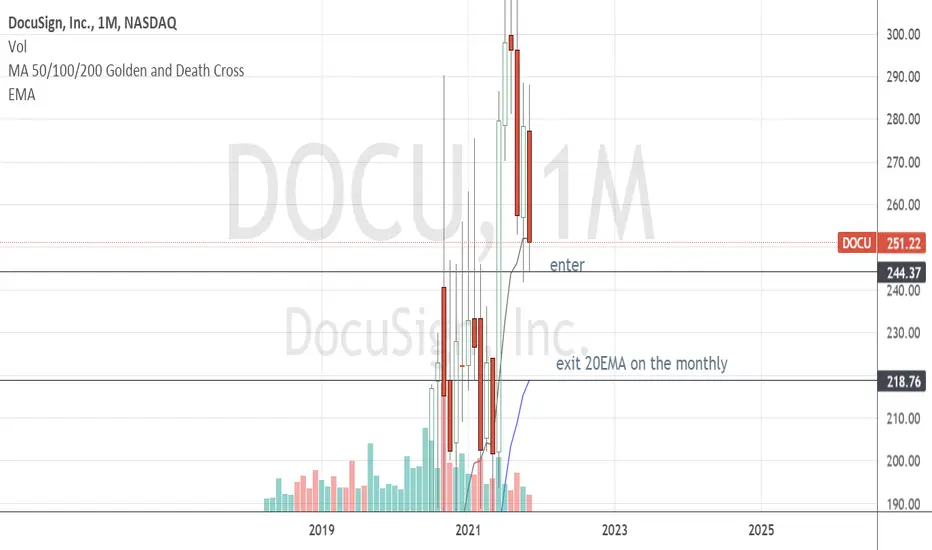
DOCU - trade setupI like this setup on the downside here. Next support is the 20EMA on the monthly chart. Wait till it breaks the enter line before you get in. Very nice risk reward on this one.

The next runner after ER - $DOCUChart says it all.
Symmetrical triangle and retest of prior resistance which was swiftly bought up.

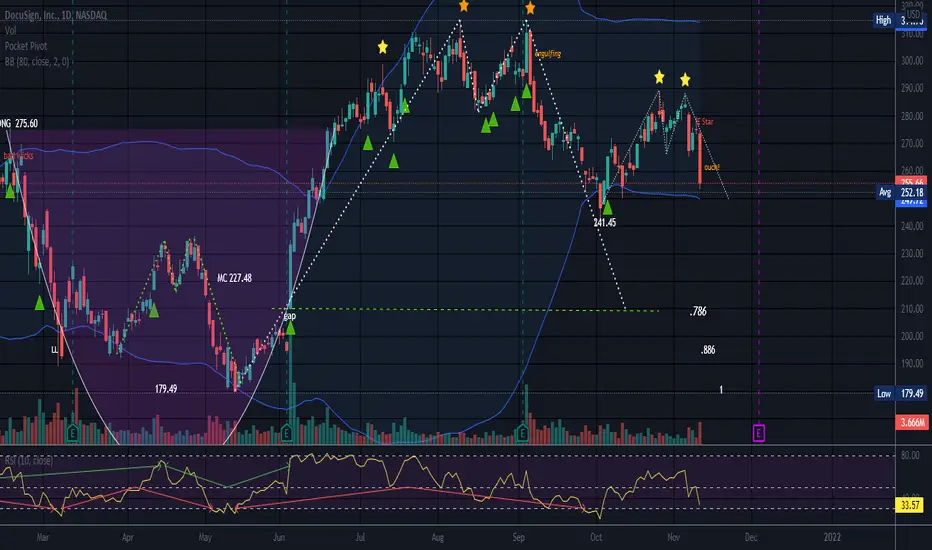
Earnings 12-2 AMCThe Evening star is a bearish candle pattern. This one is an evening doji star. The performance of this star as a bearish reversal is not great in a bull market, but you can usually expect a really bad red candle for at least the next day, even in a bull market. Whether the downtrend continues is up to Mr. Market. This is not a common candlestick pattern. It iss not seen on a regular basis like Haramis and Engulfing candles.
The evening star is a 3 candle pattern and is preceded by a decent sized green candle body. It is followed by a decent size red candle and the evening star is above both of these candles.
DOCU is being rejected on each rally up as it pushes to go higher. The top is not a pretty site.
DOCU has been unable to surpass former highs and price seems to lose momentum after each attempt to go up.
Negative volume remains high for DOCU showing interest. Short interest is around 3.65% with 3.3 days to cover.
No recommendation.