$DOCU Strong Conviction Long -Target $257I have rode this stock at least 5 times with call spreads but oddly have not posted about it for some reason. Here’s my thesis;
1. I use it to get paperwork signed religiously since COVID-19 hit, and I work for a very large investment firm.
2. Realtors rely heavily on it as well
3. Read 1 and 2 again
4. On Thursday, 9/3 DOCU is expected to report its first profits, as a publicly traded company.
5. My target is $257ish.
DOCUD trade ideas

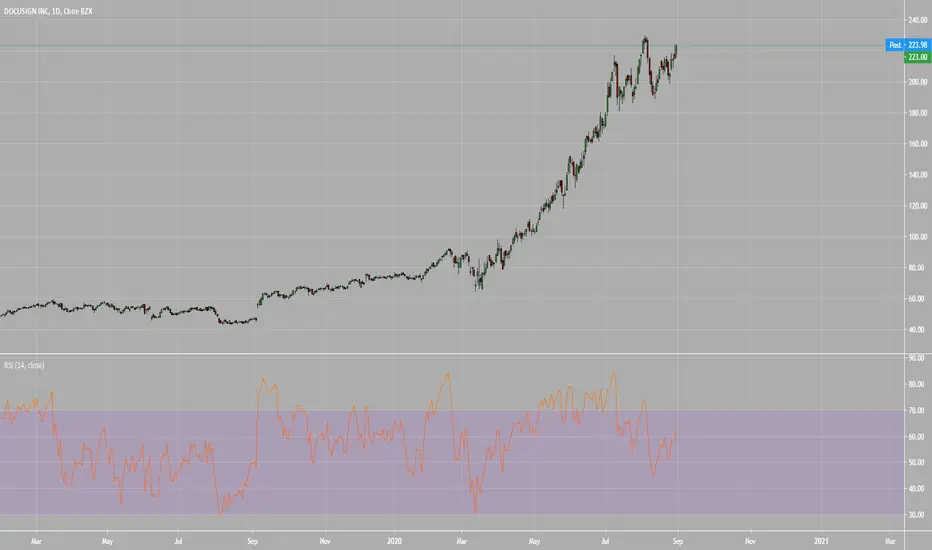
Docusign (DOCU)This thing has gone straight up and has been a beneficiary of the COVID pandemic. DOCU has currently been consolidating after its huge run from about $65.
DOCU PT $262 or $182Docu has been on an absolute parabolic move lately. Will it continue? it is currently forming a bull pennant that if the top breaks, should send this to $262. If the pennant fails, this should drop to the bottom of the pennant and could begin the formation of a bull flag. If that fails, Docu could be heading back to $152 which would be very normal after this excessive run. Fib levels state the could be a retest back to the 1.618 level or roughly $152.

❗ DOCU (8/31) - (9/4) ER Options Play ❗$DOCU ER (9/4)
Current price @216.30
LONG
Bullish Above 215
Price Target @221.20 (Resistance on Friday)
Ideal Target @228-229 (Resistance, near ATH)
Breaking above ATH and we'll push to 239-240.
Play Invalid under @214.40 (SL)
SHORT
On the downside, break and holding under 214.60 and we'll pull back to 206.69-208.10

Be careful. Possible Head & Shoulders. Support at $190Greetings. I’m slightly bearish on DOCU based on the potential head & shoulders pattern forming on the daily chart. The weekly MACD (not shown) is currently bearish. I also notice bearish divergence on the RSI indicator, which indicates that demand for this asset is waning and the trend may reverse into a bearish trend.
Happy Trading!


Head and shoulder formationLooks like a head and shoulder formation if there is a downtrend following the bull flag

DOCU back on uptrendkijun-sen breakout, bounce of SMA, stochastic leaves room to run, run to earnings.


$DOCU Waiting for Moving Average Support in DocuSign
DOCU's decline has stalled on previous support after 5 days in decline.
Thursdays rally may have been nothing more than a relief bounce, so we await
a reclaim of the 7ma.
RSi and Stochastic bottoming.
PLEASE GIVE US A LIKE IF YOU FIND OUR CONTENT HELPFUL, THANK YOU.

DOCU - Bullish morning starAfter a rather steep correction, DOCU's signal to long is triggered today: a bullish divergence as well as a morning star (3 candlesticks) formation. I went long as soon as it surpasses the 1st morning star candlestick's body @ 197 with initial stop @ 192 (below today's candle low).
Planning to scale out partially @ 215 and then around 229 or trail stops upwards as the trade goes our way.
Disclaimer: This is just my own analysis and opinion for discussion and is not a trade advice. Kindly do your own due diligence and trade according to your own risk tolerance. Thank you.


Docu Go Long minimal riskDocuSign with a strong uptrend post corona.
Respecting its lower support line every time.
2 very bad days give a good chance to go long now possible price target 230-250
Is now at 50sma 4 h Chart
Stop loss can be placed at 1 x true average range which is about 7 which means around 190-195 depending on risk level.

Docusign 20ema Since we crossed the 20 exponential moving average, we have tested it many times, to retreat and continue higher.
RSI has stayed above 50, showing no sign of strong selling.

DOCU - 8.68% Potential Profit - Ascending TriangleApproach this with care. Medium confidence on the Resistance Line due to a lack of touch-points.
Strong level of support, confirmed multiple times over the past 5 months in an uptrend corridor. Ascending Triangle formed within, just broken out.
Place a Limit Entry to ensure triangle support confirmation and decrease risk.
- Historical Uptrend and All-time High
- Pandemic-friendly Stock
- RSI + Stoch well above 50
- MACD above Signal.
Suggested Entry $220.43
Suggested Stop Loss $214.69
Target price $239.17


