EBAY analysisOverall, $EBAY is bullish.
- Rejecting the .618 fib
- Oversold in the MFI
Trapped in a channel
For day traders, buy now and TP at $51.40-$52 (Double Top formation)
For swing traders, buy now and hold through the "double top" sell off that might happen
OR wait for price to come down to $46.50 which is our BEST buying area
I think that since we are so low in the channel, buying in this area is good.
EBAY trade ideas

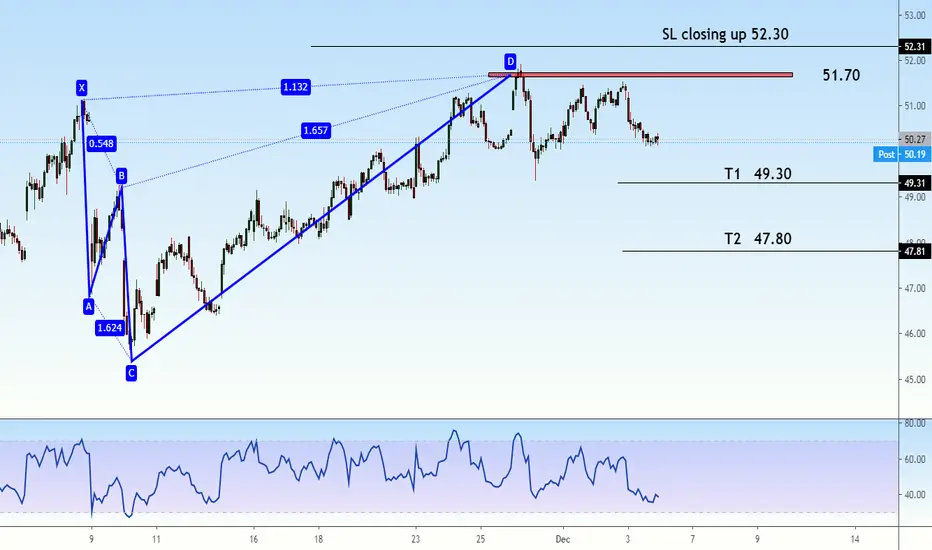
$EBAY - Short-term Long OpportunityThis is pre-breakout but presents an excellent risk-to-reward.
Breakout point is ~$52 - this would confirm my target of the 61.8% extension.

Based on Technicals, Ebay Target 48-46. Option PutRecently hearing news of hedging position of EBAY was something I didn't hesitate to close out last week after I noticed it started to putter out of its uptrend I had hoped for it to catch on from a 5% dip from 53 towards 48-47. I expect higher prices but nothing higher than 52.50 where I'll buy 2 week expiration puts for 48. I don't expect price to fall past there as of right now I just notice the past few trading sessions its been showing greater weakness. Looking to close the position shortly above 40%+


Dead in the water?We remain long from 48.90 but Ebay has been a slow burner. When the model signaled buy we though ebay would be one of the better performers but it seems to be heading in the wrong direction. Similar to AMZN it has done nothing for months now and unfortunately that trend continues. As long as it holds $45 we will remain long but not happy with the performance.
Ingenuity Trading Model is an algorithm used in- Stock, Forex, Futures, and Crypto markets. The model is a Geometric Markov Model : Focuses on reversal and continuation wave structures
In probability theory, a Markov model is a stochastic model used to predict randomly changing systems. Markov Models are used in all aspects of life from Google search to daily weather forecast. The randomly changing systems we focus on are the equity, futures, and forex markets. The geometric element of the model is the fractal sine wave structure you can find on any chart you look at across any market and across all time dimensions.
Our model focuses on the current sine wave formation (current state)- geometric price formation along with its volume and volatility over a given time period and using that information to predict the future state- future price movement. For questions or more information feel free to contact me in the comment section or via private chat


$EBAY GAP fillLooking at $EBAY for the next two weeks we can see 53.18 soon SMAs are primed for a fill
53c with two/three weeks time are eyeing me down :)


EBay Holds Key LevelEBay was one of the surprise breakouts of early 2020. The online-auction and e-commerce stock ripped to new 52-week highs in May and kept flying on raised guidance in June. The strong numbers kept coming in July and October, but the stock just drifted and then slid lower.
The pullback landed EBAY back at a key level around $47, the old record peak from 2018. It gapped through that price area in June and bounced near it in mid-September. It’s also close to the 200-day simple moving average (SMA).
Speaking of the 200-day SMA, prices tested below on November 10. They quickly snapped back and formed a hammer candlestick, which may suggest the shorter-term decline has ended.
Given its strong results and turnaround, longer-term trend followers may look for EBAY to continue higher into yearend.
TradeStation is a pioneer in the trading industry, providing access to stocks, options, futures and cryptocurrencies. See our Overview for more.

$EBAY LongJust a few days ago I posted a neutral rating on $EBAY. Later on, I updated it to a cautious buy after a strong pump that gave most of its gains away. Today is a confirmation that a swing upwards is imminent.
The past few days were filled with fake pumps that gave up gains intraday and dropping under $49 near market close. The relatively strong close above $49.40s makes me bullish for a gap up in the coming weeks. CCI remains high at 100. MACD is also still above signal line, albeit just a small gap.
Target 1: $54
Stop Loss: $48

EBAY Long1) Bullish divergence
2) Making Higher Low
3) Volume comes in
4) Histo green
5) MACD golden cross


$EBAYNeutral right now as it holds the fibonacci support but eyeing an entry as soon as MACD crosses over.

Finally broke outSo, we broke out intraday, which was unexpected for me.
Every aspect of a breakout was given, but we have to be careful and wait for a confirmation
I am planning to buy some shares or some vertical spreads.

downtrend since we hit 52w high we have been bleeding, but its still good risk reward to grab a long here with a tight stop. id personally wait for a break of 51 and scalp it to the top trendline :) gl !
