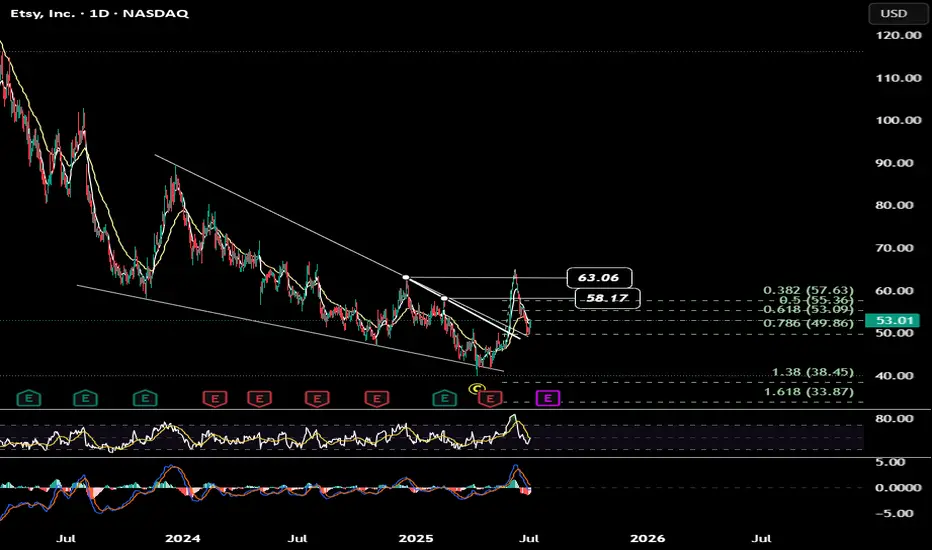
ETSY UPDATE ETSY is retesting ed trendline along with 78% fib . another chance or what !!!! same stop for me .
ETSY trade ideas
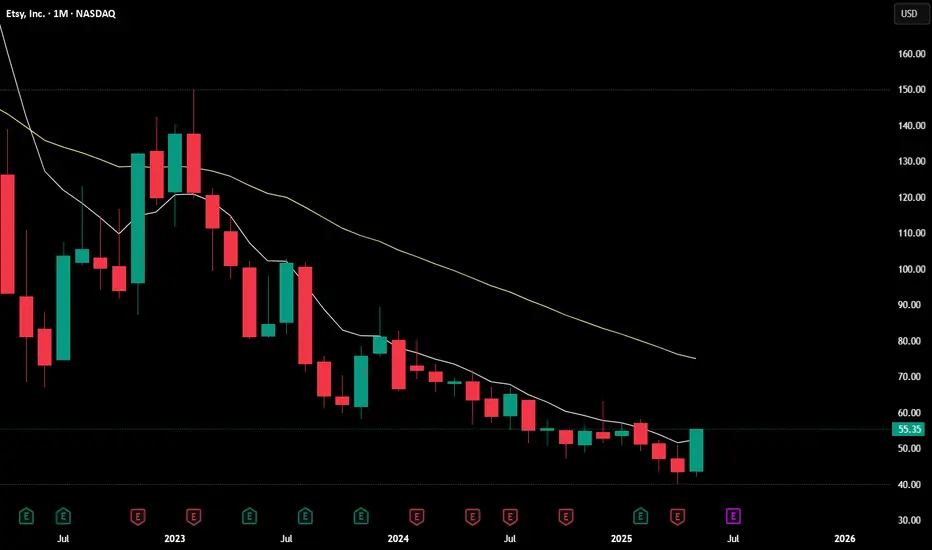
Etsy Positioned for a Strong Bullish Move Next WeekCurrent Price: $57.87
Direction: LONG
Targets:
- T1 = $60.50
- T2 = $64.00
Stop Levels:
- S1 = $56.00
- S2 = $54.50
**Wisdom of Professional Traders:**
This analysis synthesizes insights from thousands of professional traders and market experts, leveraging collective intelligence to identify high-probability trade setups. The wisdom of crowds principle suggests that aggregated market perspectives from experienced professionals often outperform individual forecasts, reducing cognitive biases and highlighting consensus opportunities in Etsy.
**Key Insights:**
Etsy has broken out of a descending wedge pattern, a bullish technical indicator that frequently signifies the end of a downturn and a shift in market sentiment. This breakout is complemented by a “golden cross” formation, where a short-term moving average crosses above its long-term counterpart, often associated with sustained bullish trends. These technical patterns, paired with increasing volume during the breakout, indicate growing investor confidence and the potential for significant upward momentum in the near term.
The company’s niche focus on craft-based e-commerce positions it well amid trends favoring small business support and unique products, adding further long-term growth potential. Recent volume-weighted metrics also show positive divergence, signaling underlying demand even during market-wide hesitations.
**Recent Performance:**
Etsy has recently recovered from a multi-month decline, trading at $57.87 after forming a strong support base around $54. This recovery has been marked by increasingly higher lows and higher highs, confirming the presence of an uptrend. The breakout from its descending wedge pattern was accompanied by above-average trading volume, underscoring market conviction in the move.
**Expert Analysis:**
Analysts are optimistic about the breakout’s implications, citing the combination of technical indicators that suggest Etsy is entering a bullish zone. A short-term target range between $60 and $64 aligns with Fibonacci retracement levels from prior downturns, while a long-term price objective could extend significantly higher if the upward trajectory sustains. The golden cross and robust RSI levels further validate a bullish stance, suggesting that momentum is far from peaking.
**News Impact:**
No major news headlines have directly driven Etsy’s recent movements, but broader macroeconomic factors, such as holiday season spending increases and potential improvements in consumer sentiment, could provide additional tailwinds. Furthermore, Etsy’s unique marketplace offering remains a draw for consumers even amid economic uncertainty, which could shield it from industry-specific headwinds.
**Trading Recommendation:**
With Etsy showing clear signs of bullish momentum and technical breakout patterns, a long position is recommended for traders seeking short- to medium-term gains. The initial target at $60.50 and the secondary target at $64.00 present attractive profit areas, while stop levels at $56.00 and $54.50 provide ample downside protection. This trade setup is supported by the confluence of technical signals, recent performance trends, and the company’s stable market positioning.
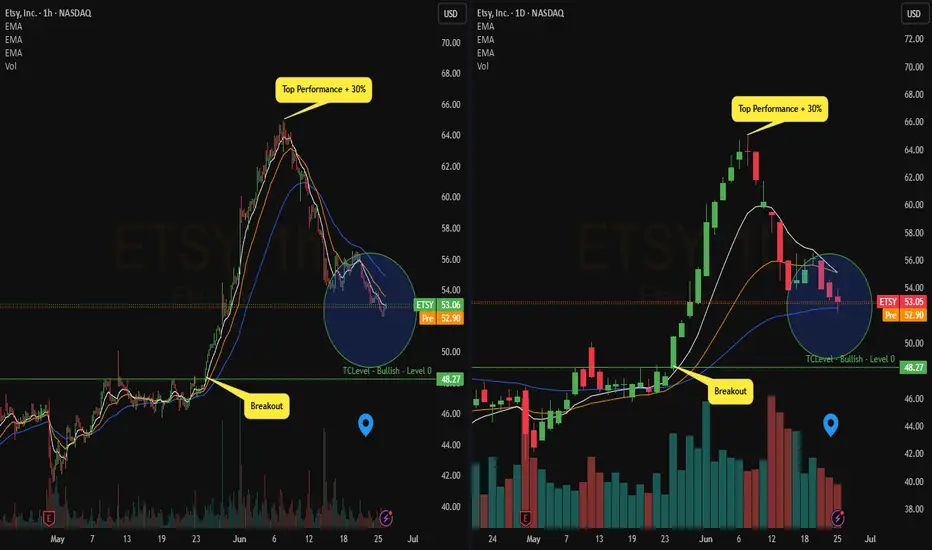
On Watch : $ETSY
- Bullish EMA on the daily with the 9 at the test of the 21
- Price at the test of the ema 50d
I expect a box here or we'll see the price at the test of the lower level
- The previous Break brought a performance of +30%
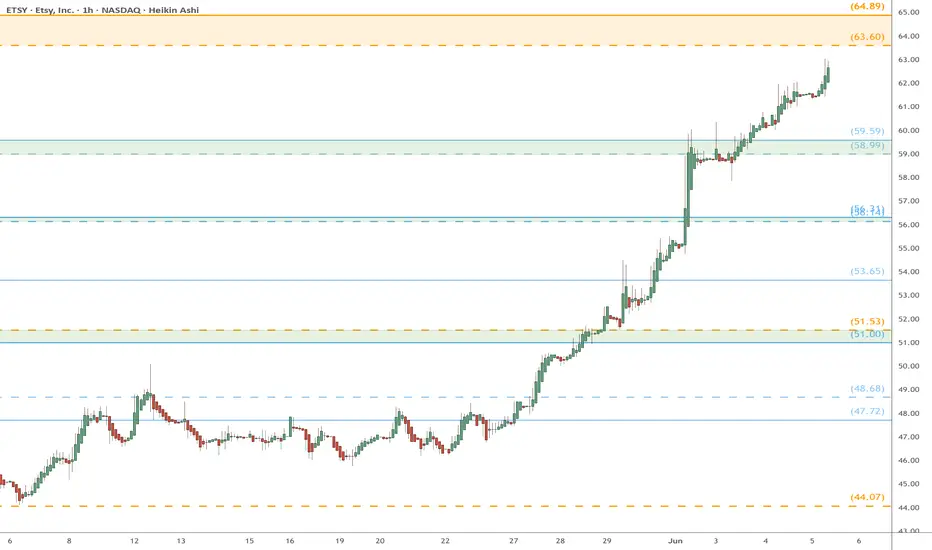
ETSY watch $64.xx: Double Golden zone to take some ProfitsETSY finally coming off its bottom and moving with gusto.
Approaching a Double-Golden fib zone at $63.60-64.89
Look for a Dip or Consolidation before uptrend resumes.
ETSY updatelong green candle + last 3 candles on the monthly time frame represents a Morning Star Candle Stick Pattern . i can tell that's Big . you can see my Elliot wave count on this one also.

ETSY eyes on $44.07: Golden fib could End Bounce or mark BOTTOM ETSY struggling against a Golden Covid fib at $44.07
Below is an even stronger Golden Genesis fib at $42.41
Those fibs define the current range that we look to break.

$ETSY hitting buy zonesLooking for a continuing downside on NASDAQ:ETSY to the $41-$42 area. Would look to add calls around there to a bounce of $45-$50.
WSL

ETSY at a ForkComing to the point of the declining triangle, either will break out, target $55, the T2 $57
or break down, support target $50, then $47.
Leaning bullish and expecting it to break out in my subjective opinion.
Looking for a Long Entry of $52.00

ETSY Santa Run? ETSY looks set for a run heading into the holiday season, like it's done the last few years. Here's why I like ETSY long, at least in the short-term heading into the New Year:
- Falling wedge breakout on the daily chart
- Rising volume on breakout moves
- Healthy consolidation above breakout
- Continuation with volume
- Gaps above (magnet)
- Large Volume Shelf at $64 area (magnet)
Let me know what you think! Full disclosure: I am positioned long. Plan to sell around $62-64

Holding the gap up after earning If the gap hold is confirmed, look for bounce higher. Consider bull debit spread in January with ATM call spread or 40 delta to capture move up.

A new upward cycle
After a full cycle of 12345, the stock was adjusted by ABC to $50. Next, a new cycle of climbing begins for several years.

Handmade ProfitsEtsy is gaining bullish momentum, with a gap forming around the $50.00 level. A break above the $58.00 resistance would signal further strength, positioning the stock to reach the $67.50 weekly resistance. With an attractive risk-to-reward setup, this trade offers a favorable opportunity, while a $45.00 stop-loss effectively manages downside risk.
In the longer term, ETSY has the potential to reach $89.59, driven by strong fundamentals. As a leader in the online marketplace for unique and handmade goods, Etsy is well-positioned to benefit from the continued growth of e-commerce. With a loyal customer base and innovative platform features, Etsy is poised to capture an expanding market share, supporting both near-term momentum and longer-term growth.
This combination of technical momentum and strong market fundamentals supports a bullish push toward $67.50, with $89.59 as an achievable longer-term target.
NASDAQ:ETSY

10/10/24 - $etsy - Probs a buy ~$50, small 1%10/10/24 :: VROCKSTAR :: NASDAQ:ETSY
Probs a buy ~$50, small 1%
- 700 fcf on 7 bn enterprise value = 10% yield
- but really call it 300 of that is stock comp (and stonk down), so perhaps you're at 6-7% "true" yield
- #s depressed and it's not growing all that fast - which is why it's been something i've stayed away for (growth is the scarcity... hence NASDAQ:CELH , NASDAQ:NXT , NASDAQ:NVDA and other meme stuff)
- but at this pt $50 seems like a pretty good smaller size entry for a 1% punt
- don't love the fact they have 2bn debt and 1bn cash
- but think the platform isn't going anywhere. still growing.
- anyone have a more nuanced view? i'm not wed to the idea, but a small position here will force me to do more work.
V

Etsy's Bearish Momentum Signals Further Downside RiskNASDAQ:ETSY shares tumbled 5% to $47.11 following a downgrade from Goldman Sachs to "Sell" with a price target cut to $45 from $70. The technical outlook is weak across both daily and 4-hour timeframes, signaling further downside risk.
Daily Technical Overview:
Oscillators: Indicators like the Stochastic %K (6.31) and Momentum (−5.92) suggest a brief potential for a small rebound, but most oscillators, including the RSI (35.75), remain in neutral territory.
Moving Averages: Both the exponential and simple moving averages across all timeframes (10-day to 200-day) signal "Sell," confirming bearish momentum.
MACD: The MACD level (-1.32) is in the "Sell" zone, indicating weakening momentum.
4-Hour Technical Overview:
Oscillators: While some short-term oscillators like the Commodity Channel Index (−121.12) and Momentum (−1.58) suggest minor buying pressure, the overall trend is still neutral to bearish.
Moving Averages: All key moving averages on the 4-hour chart indicate "Sell," confirming sustained downward pressure in the short term.
Outlook: With both daily and short-term technicals pointing to continued weakness and Goldman Sachs lowering its price target, the risk of further decline is high. The stock is trading below critical support levels, with little to suggest a reversal is imminent.
Disclaimer: This content is for informational purposes only and should not be considered financial advice. Always conduct your own research and consult with a licensed financial advisor before making any investment decisions. Trading in financial markets involves risk, and past performance is not indicative of future results.

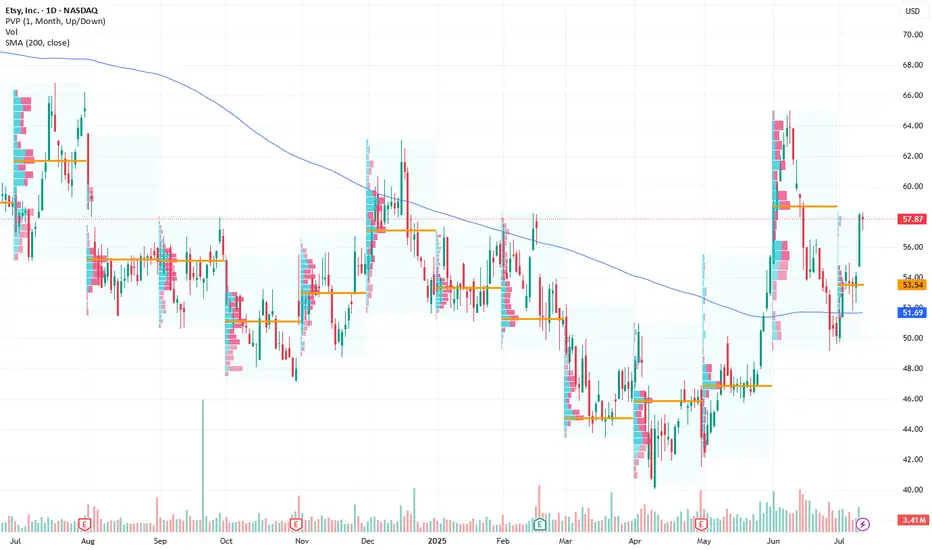
Watch $ETSY | Significant Volume EventStill rummaging around stock screener and found another one I think I like and I can't believe I'm saying it... $etsy.
Had one of the biggest volume weeks on it's record last week and price hardly moved. To me, that's a signal that there's serious support around this level.
Just keeping our eye on it for now. Set a weekly close alert above $62.83.

ETSY volatility contractionETSY just went below falling wedge. However Macd has been flat & price very near my green support zone

$ETSY LONGS @ $40Price is approaching "covid" levels.
Mitigating orders from the sell-off could create some heavy momentum to the upside.
EASY and conservative +50%, could see price back at $200 in a few years.

ESTY calls?It looks like Etsy might be establishing a solid foundation here. By the end of the year or after reporting stronger-than-expected Q4 earnings, some short sellers could be forced to cover their positions at a loss. As a profitable company, Etsy is likely to regain favor with institutional investors eventually. Personally, I'm looking to buy shares and generating profit by strategically buying shares in this area.

$ETSY - Aiming for $65Legit mad my order didn't fill today tried to open before close but was busy.
Solid in bullish regression channel, plenty of room to move in the channel as well. First fib is at $62. This was resistance at one point, but heavily favors support vs resistance historically.
Many times once it hit this channel, it consolidated before big moves up, or maintained between $62-$65.
Volume is there on the chart, but what you don't see is the options tables.
July & August Call volume at $65 spiked big today. Have my eyes set on this price point within the next 30-60 days.
also, i absolutely HATE etsy as a company. They are thieves of small businesses. I can't wait until this runs out of gas so i can go bear on it.
Not trading advice, solely technicals possibly hallucinations?


ETSY short today!Buyers can`t to protect 56 level.
Sell after break.
SHORT IN 55,70
SL 58,90
TP 42, 34,30

