F how watching fib levels.382 move would be real bullish but i suspect we bottom out at the 30 on the day
F trade ideas

Ford - Short A little late to the game but couldnt refuse this one.. Short Ford at 22.50 Sorry for the lack of charting. I think to the trained eye you can see what is happening here anyway. Back to the single digits!

$F Key Levels, Analysis & Targets $F Key Levels, Analysis & Targets
I have an open buy order at 21.48. Yes… I do think it will go lower, probably significanly, but that is going to be my starting position and I’ll update the plan once it fills.
GL, y’all…
——————
I usually trade both ways, but lately I’ve been focusing more to the downside because of how high the market is. It makes more sense to sell puts right now, and I’m usually at Target 2 or 3.
——————
I am not your financial advisor, but I will happily answer questions and analyze to the best of my ability but ultimately the risk is on you. Check out my ideas, but also do your own due diligence.
I am not a bull. I am not a bear. I just see what I see in the charts and I don’t pay too much attention to the noise in the news.
If you want me to analyze any stock or ETF just leave me a comment and I’ll do it if I can. (If I have time)
Have fun, y’all!!
(\_/)
( •_•)
/ >🚀

FORD (F) POTENTIAL SHORT TERM PRICE MOVEMENTSome price analysis on Ford stock based on trend lines and support levels.
Not financial advice, just speculation.

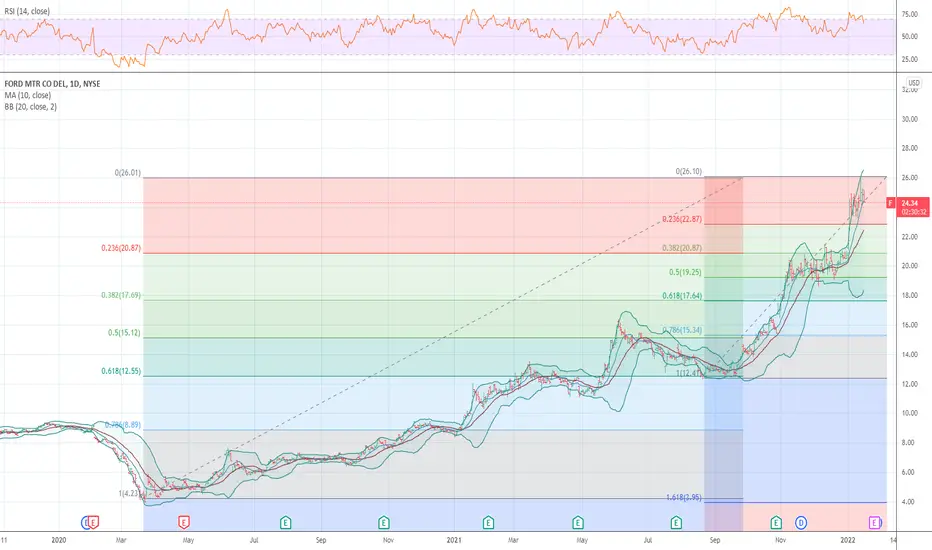
FORD look for a drop into 19 to 21 soon The chart of ford is now up over from 4 to near 26 which was 1.618 the drop 2020 to the low march , I am in puts now . soon the we could see the sell the winners and throw out the BABY with THE BATHWATER IN THE PANIC
Very top heavy here - time to short?F seems very top heavy on all time frames - I am thinking this will drop from here.
Do your own due diligence - I am not a financial advisor - just here for the entertainment.
Good Luck!

$F - Forming another step or flagI published in prior chart with the flag breakout target of $25. We have achieved that target and now we are in the next flag formation. Some may see this as a stair step pattern.
If current flag breaks out we can see $30. If the flag breaks down, we can fill the gap at $21.80 area.
Target 1 - $30
Risk - break down to $21.80 area.
———————————————————
How to read my charts?
- Matching color trend lines shows the pattern. Sometimes a chart can have multiple patterns. Each pattern will have matching color trend lines.
- The yellow horizontal lines shows support and resistance areas.
- Fib lines also shows support and resistance areas.
- The dotted white lines shows price projection for breakout or breakdown target.
Disclaimer: Do your own DD. Not an investment advice.


FORD Motor
MY ANALYST FOR FORD Motor.
Traders, if you liked this idea or have your opinion on it, write in the comments. I will be glad!!!
GOOD LUCK

EV or ICE?Looking at some of the remarks Cathie has made lately... EVs are only 2% of $F sales. Can $F make a full switch to EV over ICE in the next 5-10 years? Results? I would think we'd see the same explosive growth $F saw in the 80s. The initial reaction to the stock price so far on the promise $F is taking EV seriously and potentially its future has me feeling great about my position i started in 2018 and will be holding for a long time.

Bullish so long as 24.27 is support.My preference: Bullish push towards 26.28.
My pivot point is: 24.47.
Alternative scenario: Below 24.47 Look for 23.76 and 23.34.
Comment:
RSI is above its neutrality area at 50.
MACD is positive and below its signal line.
Price could pull back in the short term.
Ford Motor is trading under its 20 period moving average but above its 50 period moving average.
Stay vigilant
Andanced_Analyst


FORD BREAK OF CONSOLIDATIONConsolidation and flagging. Just got news with GM and considered a value over growth with inflation fear I think this could break even higher. Time will tell. Im adding to leaps at support. Cashing in at resistance with some runners

F PutMACD is showing signs of reversal and RSI is starting to come down from being super overbought. Looking for continuation to the downside and potential gap fill.


SBUX PutWe see first signs of reversal on MACD and RSI is still fairly high. Looking to continue down and potentially fill the gap.

Ford consolidating at higher levels in 22' ? NYSE:F
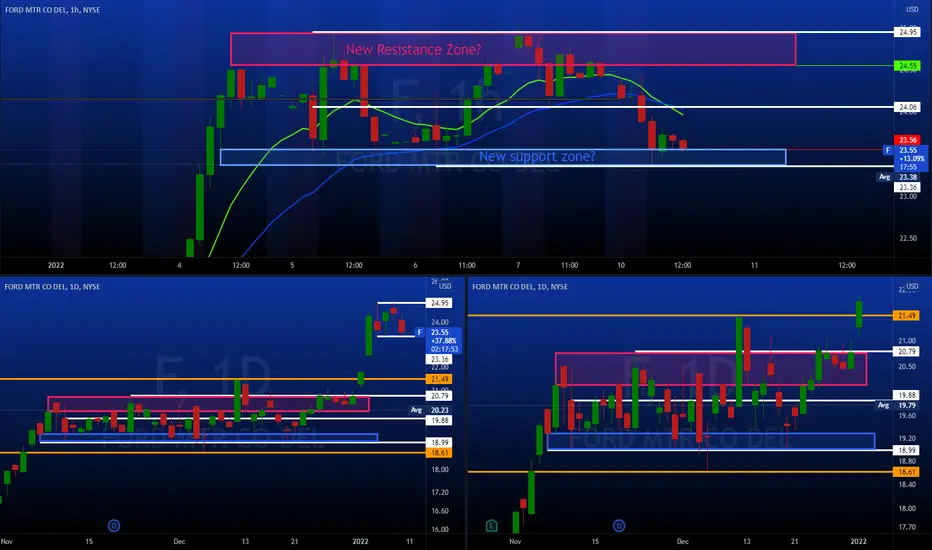
Ford consolidating at higher levels in 22'
On top you have the 1hr chart focused on Jan 4-10
Below are the 1 day charts focused on Nov - Dec
Take notice of the range Ford is now creating.
I believe this is the same pattern we saw Nov-Dec while it consolidated between 19-21 where the market needed time to absorb the new prices levels that hadn't been seen in 20 years
Looking for this new range to form at 23-25
Lets see how this ages
$F finally making it's run.Hello Traders,
I notice the potential gap-up back at around Nov 20th, and it looks like the volume finally started coming in. I know it's not a flashy name, but if Ford can break above 21.45ish, we could see a significant additional run. About 3 more points.
Good luck.
Cheers,
Mike

Ford - levels to consider 1/10/22$F
Support 24.06
Resistance 24.95
Consider Calls above 24.95
Consider Puts below 23.66
After 2 months of consolidation between 19-21 Ford has recently broke out to levels not seen for 20 years. Can't find a bad article on $F right now. Although Im bullish, consider a pullback

Ford Analysis 09.01.2022Hello Traders,
welcome to this free and educational analysis.
I am going to explain where I think this asset is going to go over the next few days and weeks and where I would look for trading opportunities.
If you have any questions or suggestions which asset I should analyse tomorrow, please leave a comment below.
I will personally reply to every single comment!
If you enjoyed this analysis, I would definitely appreciate it, if you smash that like button and maybe consider following my channel.
Thank you for watching and I will see you tomorrow!

1/9/22 FFord Motor Co ( NYSE:F )
Sector: Consumer Durables (Motor Vehicles)
Market Capitalization: 97.668B
Current Price: $24.44
Breakout price: $24.90
Buy Zone (Top/Bottom Range): $23.35-$21.75
Price Target: $25.80-$26.70 (2nd)
Estimated Duration to Target: 41-45d (2nd)
Contract of Interest: $F 3/18/22 25c
Trade price as of publish date: $1.82/contract

Ford pullback idea SHORTFord pullback to trendline for potential gap fill with overbought RSI. NYSE:F

EV SpaceAll eyes on the EV Space in 2022 and beyond
Of these 4, LCID has had the best return since 2021 but it has been extremely volatile and hasn't made new highs
F has quietly outperformed TSLA, GM, etc.
I am currently long Ford and Tesla
