FORD MOTOR COMPANY Daily TimeframeSNIPER STRATEGY
This magical strategy works like a clock on almost any charts
Although I have to say it can’t predict pullbacks, so I do not suggest this strategy for leverage trading.
It will not give you the whole wave like any other strategy out there but it will give you huge part of the wave.
The best timeframe for this strategy is Daily, Weekly and Monthly however it can work any timeframe above three minutes.
Start believing in this strategy because it will reward believers with huge profit.
There is a lot more about this strategy.
It can predict and also it can give you almost exact buy or sell time on the spot.
I am developing it even more so stay tuned and start to follow me for more signals and forecasts.
FD trade ideas

F (ford) is at the gate... ready...1 ...2 ...3 .... GO!!!Ford Motor Company feels left out. Make room at that electric pump :)

BUY FORD We have a lot of congruence in the price with the analysis, we have an investment horizon in days, a good profit, about to break the resistance and a final in the elliot waves and always remember ... do not operate without SL. Let's see what happens.

BUY FORD CALLSI just bought some ford calls for $14 strike price for December 21st. I think the price can reach up to $17 dollars a share. Anyone agree with me? am i doing something right?

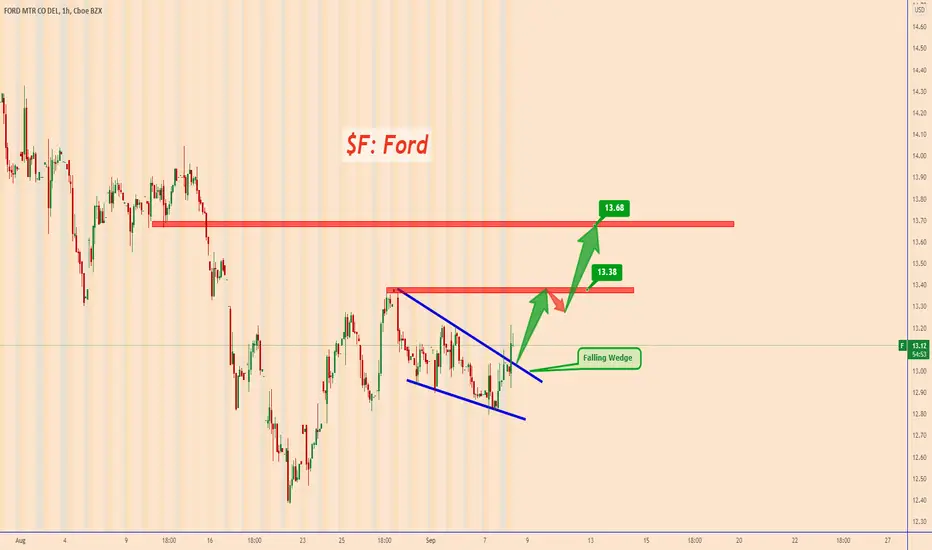
F: Ford Looks Ready For a ReversalThe price tested a strong support zone near $12.40 and now we can see the formation of a bullish wedge pattern. We can see a pattern break out that can be accompanied by a strong bullish movement.
Short Term Targets:
$13.38
$13.68
Thank you and Good Luck!
Bullish on Ford $FDespite the global chip shortage & covid I am bullish on Ford:
1. They have already started poaching tech talent; their most recent hire ran major product projects at both Apple and Tesla
2. ^ While it can be said that basically all car manufacturers will have to pivot to electric to adapt in the changing marketplace, Ford has the brand recognition and loyalty to garner fans of their increasingly-growing electric line up
3. Any news on new tech hires or EV models will be a strong catalyst
Bear scenario: more news on covid numbers and chip shortage drives price to ~$10-11 range in near term
Bull scenario: price consolidates around high $11s/low $12s before continuing to march up
this is not financial advice, just an opinion


Ford up after bearish channelDowntrend channel could continue before support line 11.14 and we presume bullish break out

DownTrend Ford This is a DownTrend from Ford Motor Company, daily chart is used, the downtrend could be seen as an area or a zone, more than a perfect downtrend line.

$F HTF ACB Long#1 Secondary Watch
$F HTF ACB Long
Same as before, still awaiting further pullback.
Lots of great monthly closes which continue to add more stocks to my development list.
RR - 3 (back to previous highs)
Additionally on Watch:
Secondary - $PENN HTF IBO Long
Secondary - $XBI HTF IBO Long
Secondary - $TRIP HTF ACB Long
30 stocks on development needed list
Live Trades:
$TLRY
$MSTR
$OEG
$AMC
$F HTF ACB Long#1 Secondary Watch
$F HTF ACB Long
Same as before, still awaiting further pullback
RR - 3 (back to previous highs)
Additionally on Watch:
Secondary - $PENN HTF IBO Long
Secondary - $XBI HTF IBO Long
Secondary - $TRIP HTF ACB Long
23 stocks on development needed list
Live Trades:
$TLRY
$MSTR
$OEG
$AMC

F 4H COMICALToo much retail hype which we know big players like to dump on them. feds taper start Q4 2021 so best of luck with these $50 PT. predictions... Ford, GM, and all the others are competing with their own current lineups, future lineups, and competitors. INSANITY

$F HTF ACB Long#1 Secondary Watch
$F HTF ACB Long
Same as before, still awaiting further pullback
RR - 3 (back to previous highs)
Additionally on Watch:
Secondary - $PENN HTF IBO Long
Secondary - $XBI HTF IBO Long
Secondary - $TRIP HTF ACB Long
22 stocks on development needed list
Live Trades:
$TLRY
$MSTR
$OEG
$AMC
$NSC
Ford (F) Ford Motor Company Bull CaseA few decent buy points here. You could buy now. You could buy on the breakout of the reverse head and shoulders. You could buy on the overall pattern breakout.
F at $14 is probably your best risk option, although the reward for buying at such high probably is less than it is now.
If you're a contrarian then shorting from the top of the current channel makes sense as well.

F Buy OppurtunityF has been following the ProAlgo Reversion Bands religiously on larger time frames and just hit a TP trigger Buy signal right off lower reversion support. With electric vehicles becoming a huge focus, this is a buy here.

$F HTF ACB Long#1 Secondary Watch
$F HTF ACB Long
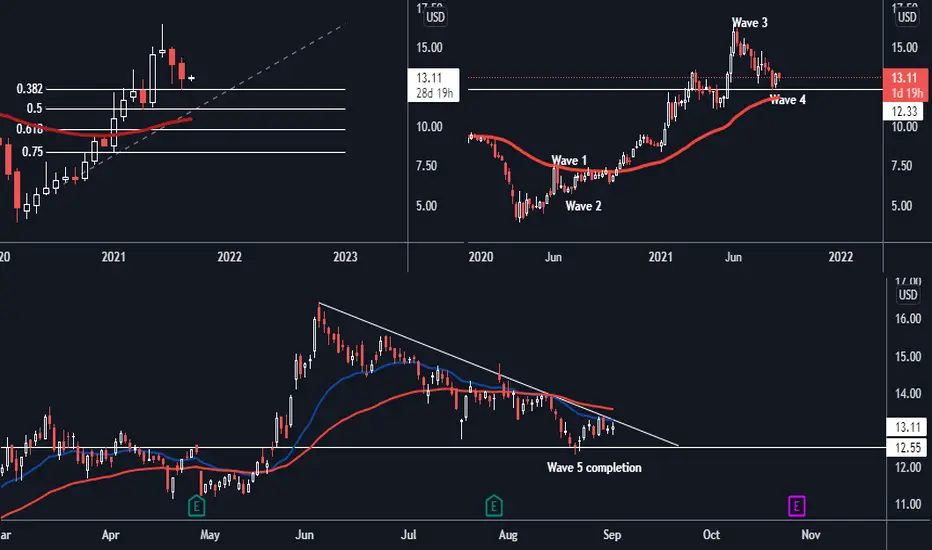
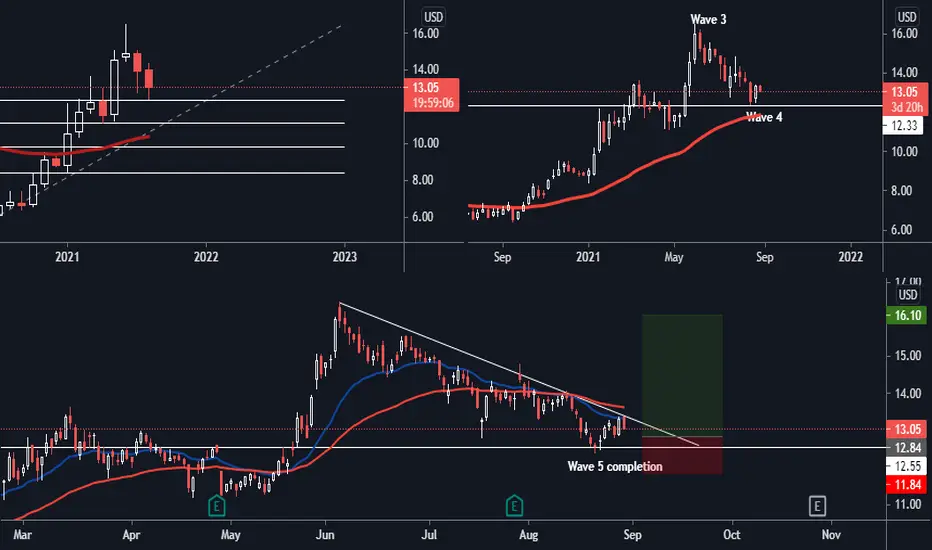
Monthly - Pullback to 0.382 fib
Weekly - Horizontal Support/50 ema
Daily - Descending triangle/Horizontal Support/Wave 5 completion
LTF - Confirmed trend change
To enter - Need a pullback to support on the daily giving the extra decel and best entry point
RR - 3 (back to previous highs)
Additionally on Watch:
Secondary - $PENN HTF IBO Long
22 stocks on development needed list
Live Trades:
$TLRY
$MSTR
$OEG
$AMC
$NSC


FFord to exit the minor downtrend, which might require some effort. Strong supports below, bullish flag if zoomed out

FORD CO HTF M1FORD CO HTF M1. Another stab into resistance? Potential for uptrend on D1 to be reversed as price heads into M1 supply zone.


Ford Lightning - Upcoming Best EV Sellers - Prove it!EVS have been hyped forever now. Lets see if Ford's supply chain can hold up and beat out the goofy Ponzied Cyber Truck. Gross. Anyway.... everything rally is up. Find quality with profits TODAY, not 20 years from now!
*valuation matters
NOMO FOMO
Stop Pogging! Learn to Invest. You'll do great.

Ford riding the wave of the futureWith it's streak of positive earnings that are beating estimates, Ford motors looks really cheap.
The main theme has been it's involvement in the EV business, which has a strong growth prospect. As you can see on the chart a strong uptrend is in motion and the market is taking a breather, which makes a good opportunity to jump in.
Buying at market open, with a stop loss of 10% below entry level. Remember not to put all your eggs in one basket and allocate no more than 5 to 10% in one stock.
Good luck,
