GE trade ideas

GE - Reminder of The TrendReminding viewers of what we posted 17 months ago! Lots of research being published today. The simple version is to remember Basel III agreement TCE ratios. That being addressed, GE will need capital.
How that does it remains to be seen.
GE needs a minimum of $32.25 billion adding non controlling equity back to the balance sheet. A maximum of $52.56 billion taking out non controlling equity.
This equates to a negative $5-$10 per share currently.
2019 Cash Flow is estimated to be ~$8.812 billion. At no growth this produces an intrinsic value of $6.14 - $14.13 per share.


GE formed bullish shark a good long opportunityPriceline of GENERAL ELECTRIC CO (GE) Stocks has completed a bullish shark pattern and entered in potential reversal zone.
From here price aciton will take bullish divergence soon insha Allah.
I have defined targets using Fibonacci sequence as below:
Buy between: 9.33 to 8.94
Sell between: 9.67 to 10.42
Regards,
Atif Akbar (moon333)

GE Bullish CallsShowing positions i placed yesterday and today.
Long calls with 09 August expiry
entered 9.5 strike with .30 and .18 cost per contract
9.80 price target


Possible 3rd Quarter Break Out for GEI was looking at this trying to determine a downward trend for GE but based upon the RSI and MA I am more optimistic that there may be an upward tick coming. I would suggest watching this for the next few weeks as it test the support / resistance barriers. Earning were nothing special but RSI suggest there may be a slight undervaluation here.

$GE Reversed off .5 Fib, Falling Wedge. (Earnings Tomorrow)Please see callouts on chart. Trade with caution, as earnings release tomorrow may invalidate this setup.
If key resistance is broken, I expect movement at least to $10.90
Goodluck!


General Electric (GE) Long-TermClear triangle pattern forming before eventual breakdown to continue GE's gradual fall
NYSE:GE

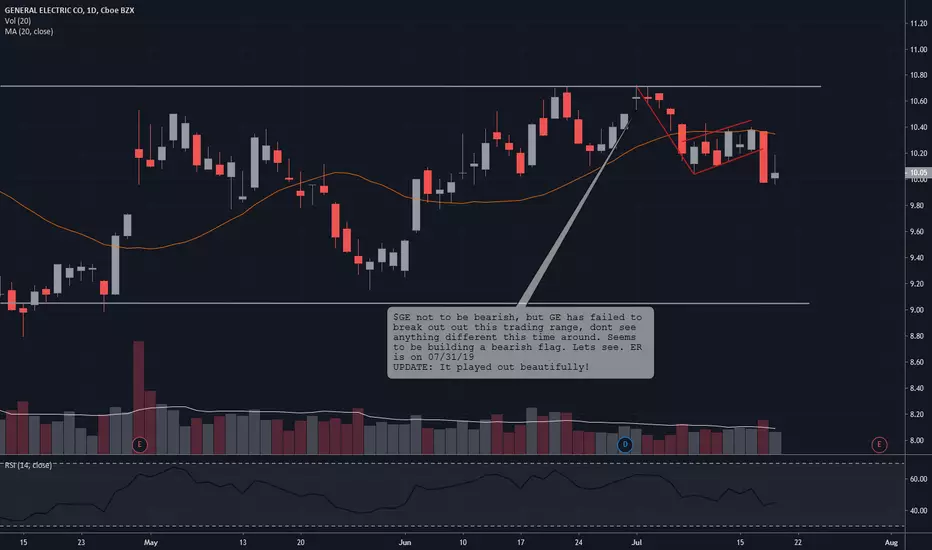
$GE bearish flagI dont have to much confidence in $GE , looks to be forming a bearish flag, lets see if it comes to fruition.

Daily GE stock price trend forecasts analysis 15-JUL
Investing position: In Falling section of high risk & low profit so far. But it would be in rising section tomorrow
S&D strength Trend: In the midst of a rebounding trend of upward direction box pattern price flow marked by limited falls and upward fluctuations.
Today's S&D strength Flow: Supply-Demand strength has changed to a strengthening selling flow when stock market opening.
read more: www.pretiming.com
Forecast D+1 Candlestick Color : GREEN Candlestick
%D+1 Range forecast: -0.1% (HIGH) ~ -0.8% (LOW), -0.2% (CLOSE)
%AVG in case of rising: 2.3% (HIGH) ~ -1.0% (LOW), 1.3% (CLOSE)
%AVG in case of falling: 1.0% (HIGH) ~ -2.5% (LOW), -1.7% (CLOSE)

GE moving up into Q2 earningsWatching for this to continue moving up. Must break resistance levels near 10.51 and 10.7

Long GE if it can break resistanceBeen trading sideways - but if it can break resistance lines 1 and 2 I see upside potential. moving averages above trend just needs a breakout.


pin bar daily candle @ 200 day EMA pretty simple set up ill be looking for a break above 10.57 to go long, if the scenario ends up a bearish one ill look for a break of that pivot level to take us down to S1 or that red support for a 3rd test 9.50-9.60 area, would be a great spot to get bullish again if we test and hold that 9.50-9.60 area

GE - Daily 7-7-19Upside:
- Ascending triangle forming over the past month
- The bottom of the ascending triangle is closely in-line with the 20-day SMA, providing additional support
- Inverse head and shoulders set-up forming since early February
Downside:
- Stock price has failed to break above $10.71-$10.72 on three separate days, potentially leading to a double-top set-up
- Volume has slowly been trending down
Notable Prices:
- Top of ascending triangle (also potential double top level) is $10.72
- Bottom of triangle and 2-day SMA is $10.35
I am watching to see which way out of this narrow range the stock price breaks and the volume that is associated with it.

Possible break out or trade the range$GE, Looking good, possible break out, if fails trade the range.

GE bullish The GE headlines are not flattering; however, the week candle stick chart has formed a bull flag pattern. Empirically, This particular pattern has a high probability of being accurate. Also, I find the larger the time frame the more accurate my prognostications become.

