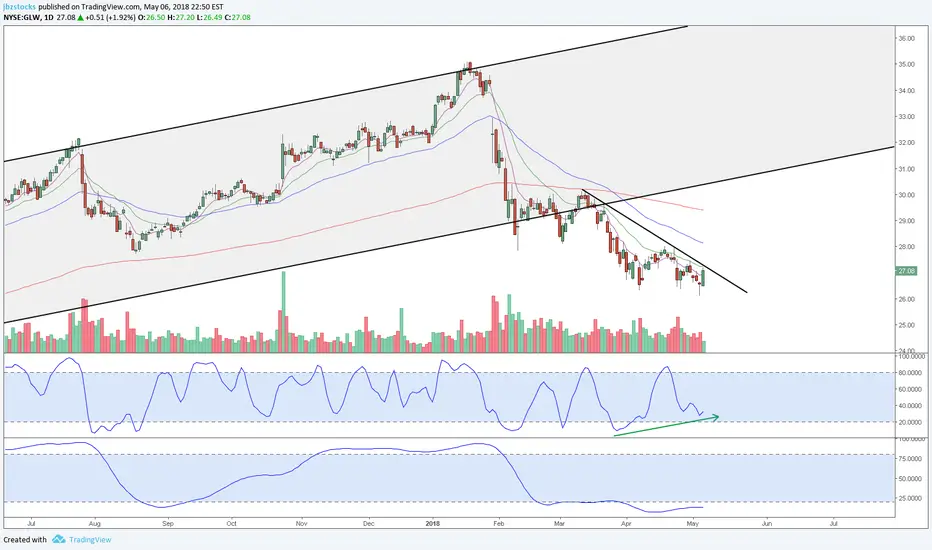
GLW 17 & 9 RRR shortsTrading Methodology:
1. An asymmetric bullish/bearish pennant is drawn using ascending and descending curved trend lines with a minimum of three price action touche points per line. The direction is determined by the previous trend.
2. The angle tool is applied from the earliest two trend touch points, beginning at the earliest touch point.
3. A trend-based Fibonacci retracement triangle is drawn starting from the earliest trend touch point and ending at the earliest touch point of the opposite trend line .
4. Based on the degree, of the earlier defined angle, the appropriate (and secret) levels are selected for the fibonacci retracement ; two levels for stop-loss and two levels for take-profit. The closest stop-loss level to the current price level is the top priority stop-loss. Though the secondary stop-loss level is often chosen for some markets such as FX and some equities in order to account for seldom unexpected resistance breaks. The greater target level is the top priority, and where majority of the shares are sold, though some may choose to close part of the position at the first target level or set it to be the stop-loss once price exceeds it. Entries should be laddered in around the levels closest of the yellow line.
This trading strategy can be applied to any market and time frame, and positions most often garner the greatest risk-to-reward ratio with the highest success rate. What more can you ask for? I will only be posting my unique trading strategy until EOY. I work solely with price action to identify pennants and apply unique trend-based fibonacci retracement levels for SL and TP levels. Reach out to me if you have any questions.
GLW trade ideas

GLW 8 RRR shortTrading Methodology:
1. An asymmetric bullish/bearish pennant is drawn using ascending and descending curved trend lines with a minimum of three price action touche points per line. The direction is determined by the previous trend.
2. The angle tool is applied from the earliest two trend touch points, beginning at the earliest touch point.
3. A trend-based Fibonacci retracement triangle is drawn starting from the earliest trend touch point and ending at the earliest touch point of the opposite trend line .
4. Based on the degree, of the earlier defined angle, the appropriate (and secret) levels are selected for the fibonacci retracement ; two levels for stop-loss and two levels for take-profit. The closest stop-loss level to the current price level is the top priority stop-loss. Though the secondary stop-loss level is often chosen for some markets such as FX and some equities in order to account for seldom unexpected resistance breaks. The greater target level is the top priority, and where majority of the shares are sold, though some may choose to close part of the position at the first target level or set it to be the stop-loss once price exceeds it. Entries should be laddered in around the levels closest of the yellow line.
This trading strategy can be applied to any market and time frame, and positions most often garner the greatest risk-to-reward ratio with the highest success rate. What more can you ask for? I will only be posting my unique trading strategy until EOY. I work solely with price action to identify pennants and apply unique trend-based fibonacci retracement levels for SL and TP levels. Reach out to me if you have any questions.


GLW sure looks toppy to meI hate to call a top but this sure looks like a top with near term potential fib fan cross right below. Lots of risk up here. Those past earnings were amazing though.

GLW just broke outBullish on GLW
A lot of bullish signals in the past few weeks
rounding bottom
earnings gap up
a few weeks of consolidation
break out of consolidation base

$GLW C&H Breaking Out$GLW C&H Breaking Out - will be some resistance at $35, but once that level is broken we could see $40 by next earnings report late October.
Note: Informational analysis, not investment advice.

Bullish on GLW (Corning)8 month rounding bottom completed
gapped up huge on earnings beat
currently consolidating
In my opinion, will retest 52 week highs
and finally another break out.

GLW WatchingChart used for my own historical reference. Any input is welcome.
Potential cup and handle set up... BUUUT MACD and Force index Bearish

$GLW Overbought at Resistance$GLW Corning looking over-extended after earnings beat and subsequent run up today. Looking like resistance around $32.80 is going to hold. Expecting a retrace to at least $31.00 in the very near term, as low as $30.00 possible.
Note: Observation/opinion, not investment advice.


Here is a good buying area for this stockThis is where i would like to buy if this stock has pullback 24$ lets go !


2018 TOP pickVery bullish on this stock going into 2018
Slow mover but I think a double is very plausible
Time will tell
Check it out

GLW Sort OpportunityAn intraday high potential, Back Tested Sort Analysis.
We ll try to enter into the correction of the uptrend movement.
NOTE: ENTRY RANGE AREA ABOVE THE ENTRY POINT, IS CALCULATED UPON 80% OF THE RECORDED PULLBACK BACK TESTED PAST PERFORMANCES
DETAILS ON THE CHART
DISCLAIMER: THIS IS A TECHNICAL ANALYSIS STUDY, NOT AN ADVICE OR RECOMMENDATION TO INVEST MONEY ON.

GLW Cup & HandleGLW breaking out soon - keep an eye.
Just announced great earnings and iPhone sales soon to set off.
BOL!

GLW Sort OpportunityAn intraday (4 hour time frame) hight potential, BackTested SORT Analysis.
We ll try to enter into the correction of the uptrend movement.
NOTE: ENTRY RANGE AREA ABOVE THE ENTRY POINT, IS CALCULATED UPON 80% OF THE RECORDED PULLBACK BACK TESTED PAST PERFORMANCES
DETAILS ON THE CHART
DISCLAIMER: THIS IS A TECHNICAL ANALYSIS STUDY, NOT AN ADVICE OR RECOMMENDATION TO INVEST MONEY ON.

LLY Sort OpportunityAn intraday (4 hour time frame) hight potential, BackTested SORT Analysis.
We ll try to enter into the correction of the uptrend movement.
1) Inversed Hammer pointing sort term price reversal.
2) Three Tops Diverged to CCI Oscillator for Sort movement.
NOTE: ENTRY RANGE AREA ABOVE THE ENTRY POINT, IS CALCULATED UPON 80% OF THE RECORDED PULLBACK BACK TESTED PAST PERFORMANCES
DETAILS ON THE CHART
DISCLAIMER: THIS IS A TECHNICAL ANALYSIS STUDY, NOT AN ADVICE OR RECOMMENDATION TO INVEST MONEY ON.

Short Put SpreadGLW has 40 IVR, with decent ROC at the $29 strike.
I bought the 23 put just to reduce some of the capital reduction for now, but if assigned, I'll make room to take these shares and then sell calls.
23/29 Sept 15 put spread @ $0.44, 2 contracts.

BUY GLW @30.55 good looking price action on the hourly chart.
stop loss@ 30.33 first partial 30.9 NYSE:GLW

