GOOGL SUPPORT AND RESISTANCEGOOGL is trading near the $154.50 level after rejecting the $170 resistance zone, where a sell block (2B) is marked.
There’s a visible gap acting as near-term support around $150.
Below, major buy zones (4B) are aligned at $150–$140, with deeper support at $130, which coincides with the weekly support level.
As long as price holds above the $150 gap, buyers may attempt to regain control.
A break below $150 could push the stock toward the $140 and $130 supports.
#Alphabet #GOOGL #Trading #StockMarket #VolumeProfile #TechnicalAnalysis #Investing #WallStreet
#globaltrade #investment #investing #stockmarket #wealth #realestate #markets #economy #finance #money #forex #trading #price #business #currency #blockchain #crypto #cryptocurrency #airdrop #btc #ethereum #ico #altcoin #cryptonews #Bitcoin #ipo
GOGLB trade ideas

Alphabet (GOOGL) Shares Drop Over 7% in a Single DayAlphabet (GOOGL) Shares Drop Over 7% in a Single Day
According to the Alphabet (GOOGL) stock chart, yesterday’s main trading session opened around $163.70 but then saw a sharp decline, hitting an intraday low of approximately $148 per share. By the close, bulls managed to recover only a small portion of the losses. As a result, Alphabet (GOOGL) shares fell by more than 7% during the session – marking the worst performance among the S&P 500 constituents (US SPX 500 mini on FXOpen).
Why Did GOOGL Shares Fall?
The drop followed remarks by Eddy Cue, Apple’s Senior Vice President of Internet Software and Services, who:
→ noted a decline in search traffic on Safari;
→ revealed plans to expand Safari’s search capabilities using artificial intelligence.
These developments heightened concerns over Google’s dominance in search and its advertising revenue. According to media reports, analysts are warning of rising competition from AI-powered search platforms such as OpenAI, Grok, and Perplexity.
Technical Analysis of Alphabet (GOOGL) Shares
In our 23 April analysis, we identified a descending price channel and emphasised the psychological significance of the $150 level, which had served as a key support in 2024.
Since then, bulls showed confidence by pushing the price above the red channel. In addition, the chart has begun to outline a potential ascending trend channel (marked in blue).
However, yesterday’s statement from competitors shifts the outlook. The current GOOGL stock price is positioned at the lower boundary of the blue channel – which could act as support, reinforced by the psychological $150 level.
On the other hand, a bearish breakout below this area may revive the downtrend that began in February, potentially paving the way for a test of this year’s lows.
This article represents the opinion of the Companies operating under the FXOpen brand only. It is not to be construed as an offer, solicitation, or recommendation with respect to products and services provided by the Companies operating under the FXOpen brand, nor is it to be considered financial advice.

Google: A compelling buy at the current priceHello,
As Warren Buffett famously said, "Be fearful when others are greedy, and greedy when others are fearful." This mindset is particularly relevant right now with Alphabet Inc.
Despite being a company whose products we use daily—and will likely rely on even more in the future—Alphabet's stock recently declined following comments from Apple’s Eddie Cue regarding a drop in Safari search traffic. This has sparked concerns about Google's dominance in search and its ad revenue streams. Analysts are also highlighting growing competition from AI-driven platforms such as OpenAI, Grok, and Perplexity, raising questions about the future growth of Google Search.
While the headlines may seem discouraging, we remain confident in Google’s enduring leadership in the search space, underpinned by its unmatched scale, infrastructure, and user base. We also believe the market continues to underestimate how far ahead Google truly is in artificial intelligence.
In our view, this dip represents a strategic buying opportunity for long-term investors. Below is our in-depth analysis of Alphabet and why we believe it remains a strong investment.
Alphabet, Inc is a holding company, which engages in the business of acquisition and operation of different companies. Google Services includes products and services such as ads, Android, Chrome, devices, Google Maps, Google Play, Search, and YouTube. Google Services generates revenues primarily from advertising; fees received for consumer subscription-based products such as YouTube TV, YouTube Music and Premium, and NFL Sunday Ticket, as well as Google One; the sale of apps and in-app purchases and devices.
KEY NOTES FROM THE Q1 2025 EARNINGS CALL
Revenue up to $ 90.23 Billion (Q1 2024: $ 80.54 Billion)
Operating income for quarter one 2025 at $ 30.61 Billion (Q1 2024: $ 25.47 Billion)
Net income for quarter one 2025 at $ 34.54 Billion (Q1 2024: $ 23.66 Billion)
Diluted Earnings per share closed at $ 2.81 as at 31st March 2025 (2024: $ 1.89). Alphabet’s Board of Directors declared a quarterly cash dividend of $0.21 representing a 5% increase from the previous quarterly dividend of $0.20.
Cash and cash equivalents remained flat as of the end of March 31 2025 at $ 23.26 Billion (2024: $ 23.47 Billion)
Google advertising continues to do the heavy lifting for the alphabet business contributing $ 66.89 Billion of the total $90.23 Billion. Google Services includes products and services such as ads, Android, Chrome, devices, Google Maps, Google Play, Search, and YouTube. Of this amount, the breakdown is as below
•Google search & other: $ 50.70 Billion
•Youtube ads: $ 8.93 Billion
•Google Network: $ 7.26 Billion
Other services offered by the platforms contributed revenues as below
Google subscriptions, platforms & devices: $ 10.38 Billion
Google cloud: $ 12.26 Billion
Other bets: $ 450 million. Other Bets is a combination of multiple operating segments that are not individually material.
Hedging gains: $ 260 million
The company announced a share buyback program of up to $70 billion of its class A and class C shares. The buy backs will be executed through open market purchases or through privately negotiated transactions.
Business Opportunities/Strengths
Alphabet’s advertising business is firmly embedded in digital advertising budgets, allowing it to capitalize on the ongoing growth in digital ad spending.
The significant cash flows from advertising enable Alphabet to reinvest in growth areas like Google Cloud, AI-enhanced search, and innovative ventures such as Waymo. (Waymo is Alphabet's autonomous driving technology subsidiary, focused on developing self-driving cars and related technologies.)
With a strong foothold in the public cloud market, Alphabet has a substantial opportunity as a major provider for enterprises transitioning to digital platforms.
Risks to consider
Although Alphabet is working to diversify, text-based advertising remains its primary revenue source, presenting a concentration risk.
Ongoing investments in emerging, sometimes unproven technologies through its Other Bets segment continue to strain cash flows.
Increasing regulatory scrutiny of Alphabet's search dominance worldwide could lead to significant market disruptions through structural reforms.
Recommendation
We view Alphabet as a solid business with diverse solutions ranging from advertising, cloud business and driverless cars as well. While we acknowledge that the antitrust cases have continued to make headlines, we encourage investors to remain invested and focused on the business’s strengths. The business has unique products that will have the ability to remain leaders for a very long period of time. Android is the operating system for the majority of the world’s smartphones with more than two-thirds of all smartphones in the world running it. Virtually all smartphones, other than those manufactured by Apple, run on Android. We see this remaining as a google strength for a very long time. The Google Play Store’s unmatched ecosystem creates significant barriers for competing operating systems, limiting their access to critical applications. The recent correction on US technology companies provides us with a solid buying price for some of these great companies. Alphabet alone corrected by about 31% and has since bounced back.
We see the current price as a great entry price for long term investors based on both technical and fundamental analysis with a target price of $ 203.

Google 24 hr potterboxThis is Google with a potterbox and a inverted head and shoulder. I have a good feeling it will hit that mark.$202.61 well lets just wait and see i could be wrong. Happy trading.

GOOGL Weekly Chart Analysis, Google dumping?Google still has a B wave left for correction from Elliot wave perspective,the recent drop also suggest the wave B could be very short. Wave C is the target!!!

Google ShortGoogle is now net short on the regression break.
I am not taking this trade, but it may be the beginning of a new trend and future buy oppertunities.

GOOG Simple Short TradeCRACK!
GOOG has now broken a key area with the potential to have a huge move down.
This is a very simple trade with great risk/reward.
Bulls!! Caution is in order!!

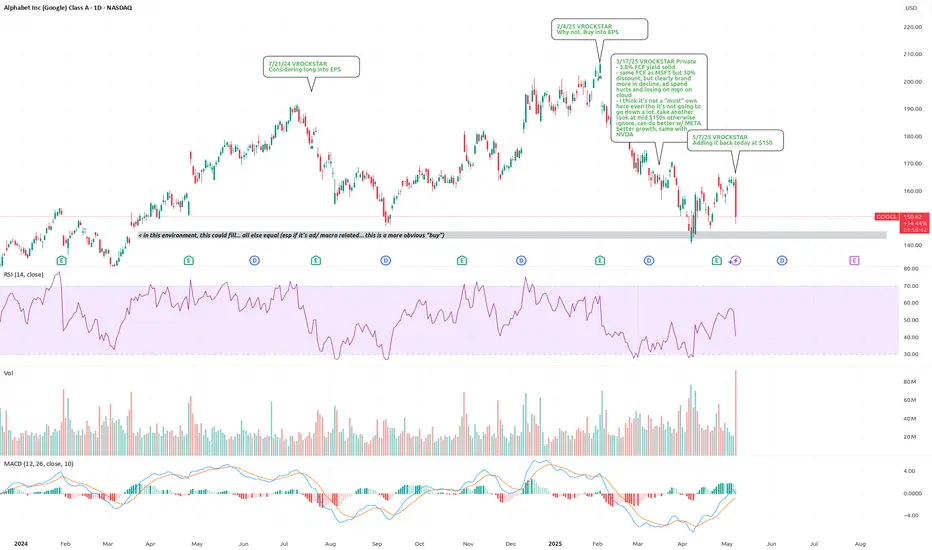
5/7/25 - $googl - Adding it back today at $1505/7/25 :: VROCKSTAR :: NASDAQ:GOOGL
Adding it back today at $150
- i'll leave valuation for another post, except to say (based on the logic below), it's more attractive than the converse.
- aapl news/ testimony saying 'search lower'. okay.
- in my own experience, it did get disintermediated by various ai chats (i use several), but ultimately i'm finding two things 1/ i am spending more time in search, so the pie is growing and that still includes the same amt of time/ searches in google and 2/ google's search has gotten much better w/ the gemini response
- will it be harder to monetize ads? probably yes.
- is the lazy google culture going to be mostly replaced by AI? also yes (hurray!) and nobody seems to want to underwrite this
- so as long as their general digital businesses (must consider maps, email, cloud... many others incl. ai effors, waymo, i could go on) remain not falling apart at the seams, i'd believe their size/ capex budget still puts google as a leading AI-software winner from today
- add to this that most of the biz is digital e.g. no tariff exposed (yes the ads they serve are affected so i get it)
- also no real "china" exposure like say aapl/ nvda etc.
- so ultimately, does it go lower? V says "idk and idc" it's one of these businesses that post last results still delivered. generates cash. valuation reasonable as i mention above (we can get into this in another note later or in the comments)
- but days like today and it's mostly deleveraging. no real money LO is selling this thing in size, the opposite
- so i'm a buyer. necking out w/ some bi weekly calls for notional which allows me to get the "fed" reaction wrong and also benefit from a move higher.
- stock is a buy here
- and thanks aapl. keep talkin'
V
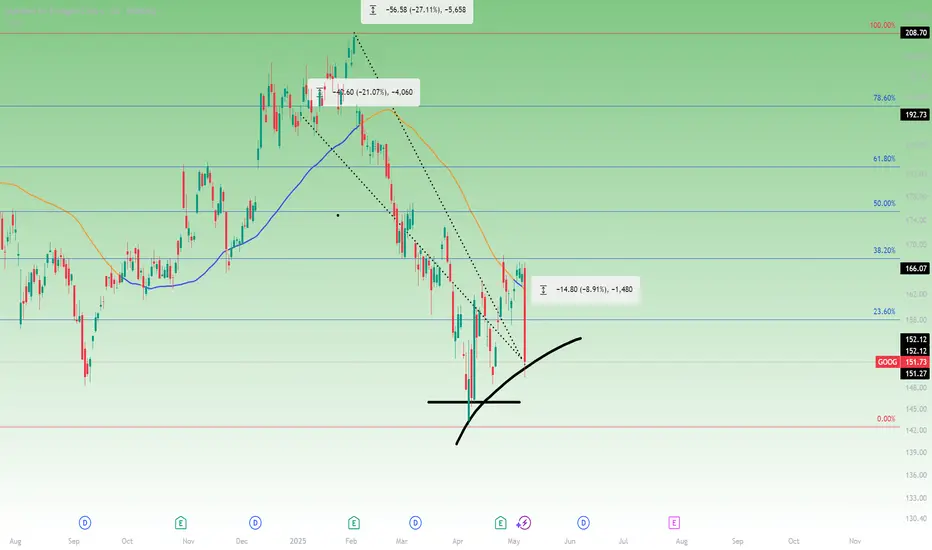
Google in trouble with Apple AI? Watch $146 next?Apple has confirmed it is actively exploring a redesigned web browser across iPhone, iPad, and Mac with a focus on AI-powered search. The potential shift away from Google as the default search provider on iOS devices, poses a direct risk to Alphabet’s search business.
Alphabet shares fell $14.11 (-8.54%) to $151.09 USD on the news, breaking below the 50-day moving average at $162.00 and the 23.6% Fibonacci retracement from the February high and April low, after finding resistance at the 38.2%.
From its February high, Alphabet is now down 27.1%, with a year-to-date loss of 21.1%.
While the stock remains above its 2025 low of $140.53, downside levels to monitor include ~$145.90.
$GOOGL Breakdown – AI Risk Is No Longer "Future Tense"🚨 BREAKING: NASDAQ:AAPL confirms they are exploring AI-powered search within Safari after a decline in browser searches for the first time ever.
💥 NASDAQ:GOOGL is down over 8% intraday, cracking long-term trendline support and decisively below the 200DMA ($173).
📉 The setup is ugly:
Insiders sold post-earnings (again).
Trendline + moving average both lost.
Volume spike and vertical price action = capitulation risk ahead.
🔻 Downside momentum could accelerate if price fails to reclaim $155 quickly.

GOOG Alphabet, Inc. is a holding company, which engages in software, health care, transportation, and other technologies. It operates through the following segments: Google Services, Google Cloud, and Other Bets.

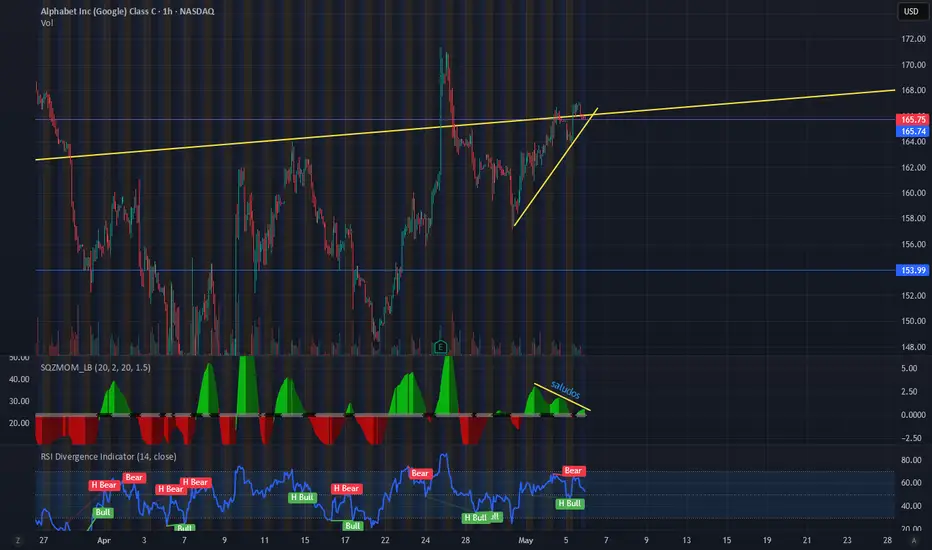
GOOGL Looks Ready to Move — Breakout or Trap?Let’s Talk Strategy 🔍
Alright, here’s what I’m seeing on GOOGL right now based on the charts and GEX data.
🧠 Big Picture (1D Chart)
GOOGL’s been grinding its way out of that falling channel since mid-April, and to be honest, it’s looking decent. It’s hovering right under that key 170.48 zone — a clear resistance from past rejections. The MACD is still positive but starting to flatten, and Stoch RSI looks like it's trying to cool off.
So for the weekly outlook, I’m watching that 170 level closely. If we pop above it with volume, we might get a clean trend continuation toward 177. If we stall or reject, could just be a lower high forming.
⏱️ Intraday Structure (1H Chart)
Zooming into the 1H, price action has been pretty choppy between 162 and 166. It looks like we're basing just under the GEX wall at 167.5–170.
Notice how we keep rejecting around 166? Yeah, that’s no coincidence. There’s a big ol' GEX resistance wall right there.
🧠 GEX Levels & Options Flow
Here’s what’s interesting:
* 🔹 Gamma Wall / Highest Net GEX sits right at 169–170. That’s our ceiling unless some major call flow or IV expansion comes in.
* 🔻 PUT support is solid at 157.5, backed by the HVL level.
* 📊 IVR is low (23.7) and IVX is slightly lower than avg → not expecting explosive moves yet unless we get a macro catalyst.
🛠️ My Thoughts & Trade Ideas
This is one of those “coiling spring” setups. If we push above 170 and hold — I’m interested in long calls, targeting 172.5 or even 177.5 by next week. But I’m not buying the top blindly. I need to see real strength above the gamma wall.
Bullish Idea:
If price clears 167.5 and GEX shifts upward, I’d grab the 170C 5/10 or 5/17, depending on momentum.
Bearish Scenario:
If we reject again at 166–167 and break under 162 with volume, I’d consider puts targeting 157.5, where the support and HVL sit.
✅ Final Take
I like the way GOOGL is shaping up. It’s showing strength but still under pressure from option market makers. I’ll be patient for a breakout — no need to front-run this one. Let the GEX and levels guide the setup.
Let me know how you’re playing this — scalp, swing, or staying out? 👇
This is just my perspective and not financial advice. Trade safe, manage your risk, and stick to your plan.

Google with bearish divergence in 1H and 4HGoogle is showing a bearish divergence in the MACD and RSI. Also, it is now trying to get into the trendline that was used as support for a few years and was lost due to the recent tariff news.
We expect a retracement at least for this week.
Analysts expect this momentum to sustain**Direction:** **LONG**
**LONG Targets:**
- **T1 = $166.5**
- **T2 = $170.0**
**Stop Levels:**
- **S1 = $158.5**
- **S2 = $156.0**
**Wisdom of Professional Traders:**
This analysis synthesizes insights from thousands of professional traders and market experts, leveraging collective intelligence to identify high-probability trade setups. The wisdom of crowds principle suggests that aggregated market perspectives from experienced professionals often outperform individual forecasts, reducing cognitive biases and highlighting consensus opportunities in Google.
**Key Insights:**
Google has recently demonstrated bullish momentum after breaking through key resistance levels at $160, signaling the potential for continued upward movement. Professional analysts expect this momentum to sustain given Google's robust buyback program, its strategic endeavors within AI and cloud computing, and its place within the broader "MAG7" tech grouping. The next resistance at $170 represents a psychological and technical milestone, with strong institutional support evident at current levels.
Additionally, Google's partnership with Nvidia in deploying the DGX cloud platform further strengthens its positioning in enterprise solutions and reinforces its commitment to capitalizing on high-growth opportunities in artificial intelligence. Combined with improving macro sentiment, Google remains well-aligned for upside potential.
**Recent Performance:**
The stock's recovery from earlier consolidation and its reclaiming of the 200-day moving average have confirmed its technical momentum. Google has gained traction in outperforming many of its peers such as Tesla and Meta within MAG7, reflecting increased investor optimism. Professional traders note that the recent breakout above $160 was accompanied by higher-than-average trading volume, signaling sustained buying interest.
**Expert Analysis:**
Experts maintain a broadly positive outlook on GOOG’s near-term trajectory, highlighting its balanced combination of fundamentals and technical improvements. The company’s strategic focus, such as investments in AI and cloud computing alongside its shareholder-friendly buyback program, creates a compelling trading setup. Recent news regarding a partnership with Nvidia’s DGX platform has further solidified expert confidence in the company’s ability to deliver growth-oriented innovations.
**News Impact:**
Recent announcements, including Google's significant share buyback and its Nvidia partnership for cloud computing, have fueled positive sentiment. These developments underscore management's confidence in Google's valuation and its push towards enterprise-driven innovations. Broader trends in tech and AI sectors also enhance Google's prospects, as its strategic moves align well with industries forecasted for strong growth over the next decade.
**Trading Recommendation:**
Given its robust technical and fundamental setup, Google presents a high-probability long opportunity for traders next week. With targets set at $166.5 and $170.0, and stops at $158.5 and $156.0, traders should capitalize on favorable conditions and momentum-driven upside. The rationale combines expectations of continued bullish movement, strong institutional support, and strategic initiatives accelerating future growth.

GOOGL daily resistance test w H&S 15m h&s right on a daily area of interest for GOOGL. price has moved sideways afterwards. new 15m lower close confirmation for puts

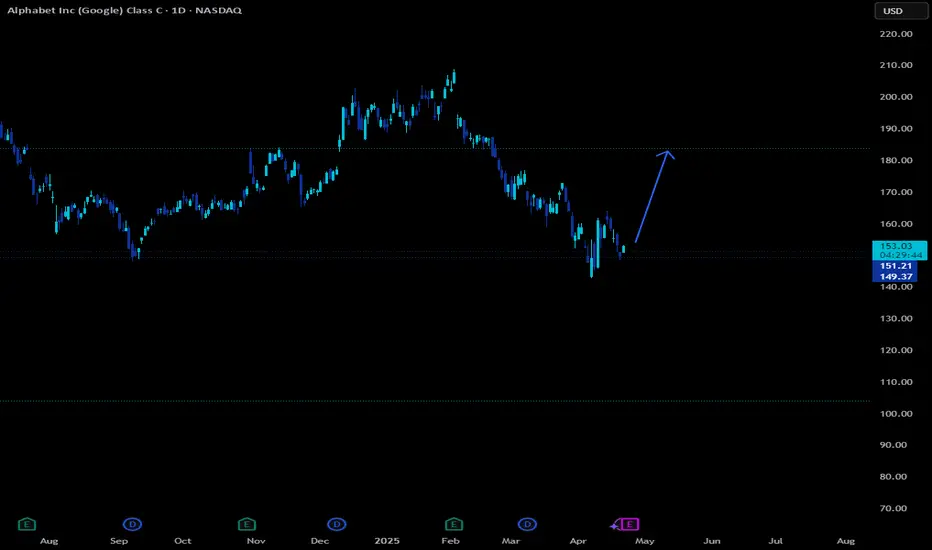
Googl at pivotGoogl is at a pivot point here touching historic levels from 2021. The company is a cash flowing machine and FUD has taken control at this point. The market forgets that the company is diversifying away from search as a business. The market forgets about youtube, waymo, and recent wiz acquisition. Stocks bottom on bad news, not good news. I think we see 200$ soon. Double bottom is apparent to me.

High Wave Candle and possibly a High FiveHere we have a High Wave Candle, Nested between the 10 EMA on top and the 50 EMA below. One strategy is to draw a parallel channel around the High Wave Candle, and be mindful of breakouts, the direction will hypothetically determine if bullish or bearish, (with attention given to lower timeframes). Another theory is that we may be in the beginning of Wave 5 of the Elliot Wave theory and to use the EMAs (purple 50 EMA and 10 EMA blue) to carefully invest in over time.

GOOGL Breaking Down or Just Resting? Watching This Zone Closely 🧐Looking at the daily chart, GOOGL had a strong bounce earlier in April but seems to be pausing right at a familiar trouble spot. Price is now stalling near the March-April highs — an area where buyers have previously run out of steam. The last few candles are showing rejection wicks, suggesting that sellers are defending this zone again.
MACD has crossed bullish but isn't accelerating aggressively, and Stoch RSI is in overbought territory — hinting at some short-term exhaustion. This makes me think we might not get a clean breakout unless volume really picks up.
Now switching to the 1-hour timeframe, you can see it even more clearly — GOOGL has been stuck in a descending wedge pattern since that big earnings candle. Price keeps testing the upper wedge but fails to break through convincingly. Momentum looks weak here — MACD is flattening, and Stoch RSI is curling down. This tells me buyers are hesitant, and the bulls need a push soon or this could slip further.
Looking at the GEX and options data, there’s a big gamma wall sitting at $165, which aligns perfectly with the top of the wedge. That's going to act like a magnetic ceiling unless there's a serious catalyst. Meanwhile, downside support exists near $157.5 where the HVL (high volume level) aligns with GEX support. IV is down -9.98%, and the Options Oscillator shows heavy PUT positioning, meaning options sentiment is skewing defensively even though price hasn’t broken down yet.
🔎 My Take:
Right now, GOOGL is in a "prove-it" zone. Bulls had a great run but are hesitating at resistance. If price can reclaim and hold above $161.30–$165 (especially on volume), that would trigger momentum continuation and possibly a gamma squeeze toward $170+. Otherwise, failure to break out — especially if price dips below $157.5 — opens up room for a quick fade toward $155 or even $150 PUT walls.
✅ Trading Thoughts:
* Bullish scenario: Look for price to reclaim and hold above $161.30 with volume. A breakout through $165 could trigger a fast move toward $167–$170.
* Ideal Call setup: 165C or 167.5C (May expiry), but only above $161.30 with momentum.
* Bearish scenario: If price gets rejected again and loses $157.50, I’d look short down to $155 or even $150 PUT GEX wall.
* Ideal Put setup: 155P or 150P (May 10DTE) if $157.50 breaks.
* Neutral: It’s in a wedge with low momentum and IV compression. Don’t force trades here — let price pick a side. This is one of those "react, not predict" moments.

Google Long Swing Tradewant to see us hold this yearly level to test the monthly shoulder. Would get out if we start breaking down here.
BULLISH TREND in The Google AnalsisA bullish trend in the google shares and can see using candlesticks making trade

TradingView Live Show: Charting Volatility with TradeStationJoin us for an insightful TradingView live stream with David Russell, Head of Global Market Strategy, as we dive into the impact of tariffs, market volatility, and key macroeconomic developments shaping today's trading environment.
Oh, and don't forget, TradeStation is sharing ideas here: www.tradingview.com
In today’s session, we’ll break down how escalating tariff tensions and unpredictable global trade policies are fueling market volatility—and how you can navigate these shifts using powerful tools on the TradingView platform.
We’re also unveiling a major update to our broker integration with TradeStation, opening the door to expanded trading opportunities. With this enhanced connection, you can now trade equity options directly on TradingView—an exciting addition to our growing suite of options tools like the strategy builder, chain sheet, and volatility analysis. These features are especially useful in today’s uncertainty-driven markets.
TradeStation, a fintech pioneer since 1982, is known for delivering institutional-grade tools, personalized service, and competitive pricing. They continue to be a trusted partner for both active traders and long-term investors looking to navigate complex markets with confidence.
This session is sponsored by TradeStation, whose mission is to deliver the ultimate online trading experience for self-directed traders and investors in equities, equity index options, futures, and futures options markets. Equities, equity options, and commodity futures services are offered by TradeStation Securities Inc., member NYSE, FINRA, CME, and SIPC.
Important disclosures:
tradestation.com/important-information/
tradestation.com/insights/etf-disclosures/

GooglLooking for a leg up to its weekly 50 sma or 174 gap close
Current pattern is A double bottom with pullback (Handle)
Strong long over 161
Stop below 158
One of the things you notice on bullish pullback is the decreasing sell volume .. that usually means a bear trap.

GOOGL eyes on $159.41-160.25: Key support that bulls MUST HoldGOOGL had a nice bounce into Resistance and retracing.
Watching well proven support zone now, at $159.41-160.25
Bulls need to Hold this zone and start going back Northward.
