$GOOGL Implied move for earningsNASDAQ:GOOGL Implied move for earnings
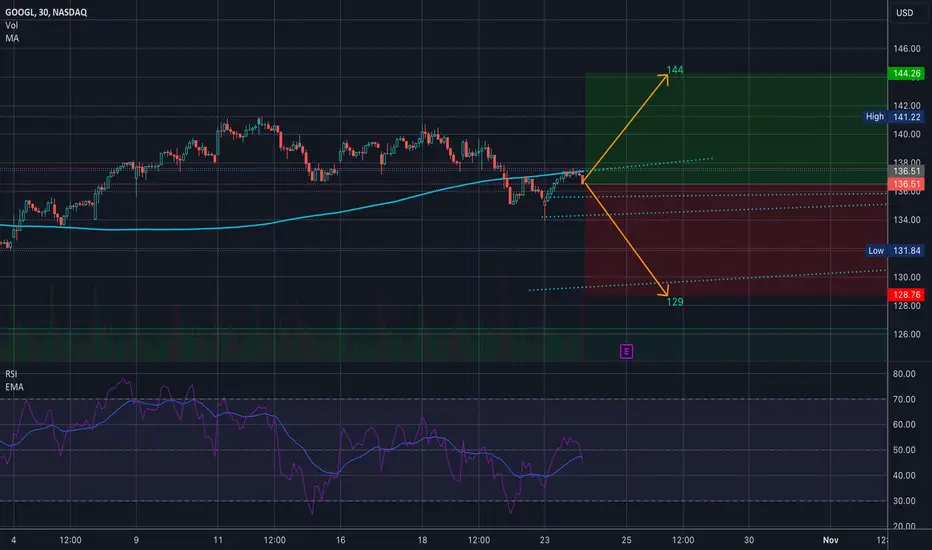
As of right now, the implied move for GOOGL earnings is wide. It might shift a little bit with tomorrow’s trading session but I’ll update this idea about an hour to market close….
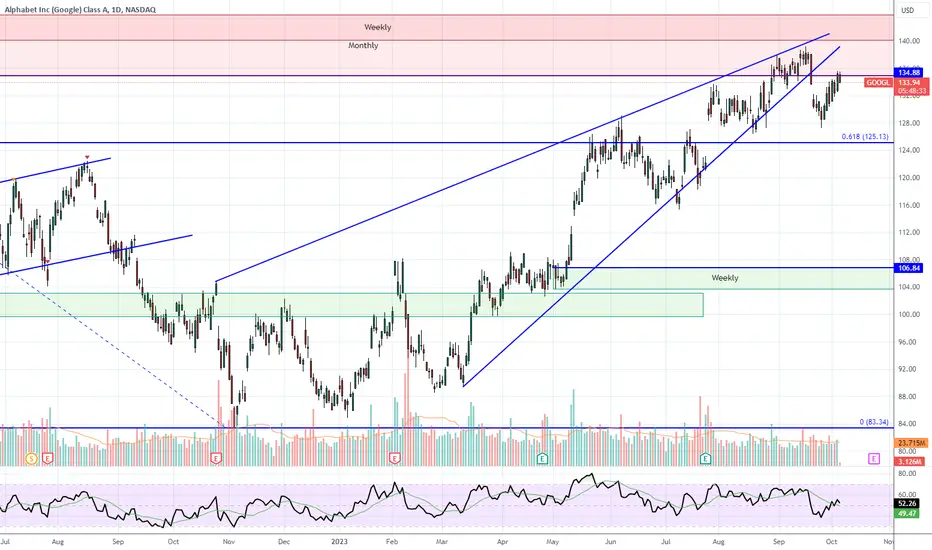
The implied move is between 129 to 144…
And right now the 30min 200 is resistance, and she’s been making lower highs
One the 1D timeframe there is a severe bearish divergence and the YTD volume profile points to lower… 105 (obviously out of tomorrow's range but it's down there)
GOGLB trade ideas
💵 E a r n i n g s J o u r n a l📶 S T A T I S T I C A L A N A L Y S I S
Current 50-Day Market Trend: long/buyers/positive.
Next Swing: neutral swing of volatility.
Next Wave: buy wave to the ceiling.
Next 50-Day Market Trend: long/buyers/positive.
Trade Type: Touch & Go don't wait for a close.
💵 E A R N I N G S A T A G L A N C E
Release Date: 10/24 AMC
Quarter: FQ3'23
_______________________________________________
Revenue Anticipations: positive surprise of Revenues.
Revenue Surprise-Confidence: on a scale of 0-9, #3
Revenue 2-Year Trend: the company trend in Revenues is positive.
_______________________________________________
EPS Anticipations: positive surprise of EPS.
EPS Surprise-Confidence: on a scale of 0-9, #5
EPS 2-Year Trend: the company trend in EPS is positive.
_______________________________________________
📝 S Y N O P S I S
🟢BUY: If the earnings report is above the Wall Street consensus, I expect the market will buy the +surprise.
⚪BUY: If the earnings report is released with complicating press, I expect the market will buy the surprise instead of investing in alternative securities.
🔴BUY: If the earnings report is below the Wall Street consensus, I expect the market will buy the -surprise.
🔎 R E S E A R C H D E P T H
Technical Analysis: daily chart.
Fundamental Analysis: EPS & Revenue data.
Press/News: none.
Social Media: none.

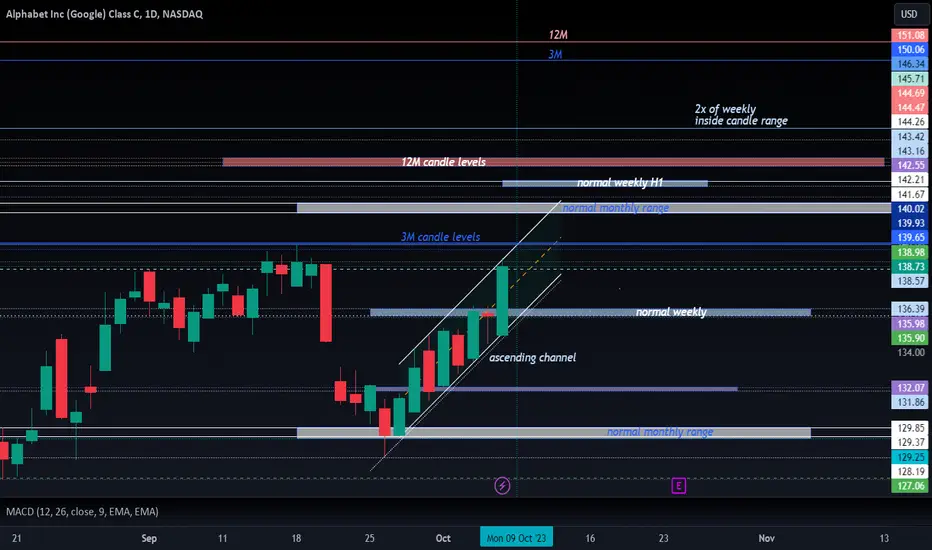
Google enjoyed the positive monthly crossover of 9 MA & 26 MApositive google is following a ascending channel, closed near the top of it, also, nearing a 3M testing level, structure is overall positive, weekly MACD upward split is not prominent, this week movement will give it the required strength possibly, also depends on the overall market strength
7 Mega Cap Tech Stocks Forecast part 2 00:00 Natural Gas stock Bulls NatGas Support & Resistance Guide
04:39 AMEX:UNG Stock Forecast
05:16 USO Oil Stock Forecast
06:27 Gold XAUUSD Stock Forecast
07:21 Silver XAGUSD forecast
06:37 US dollar DXY Stock Forecast
10:37 QQQ Stock Price Forecast
13:36 Sp500 ETF Price Forecast
15:00 Tesla Stock TSLA Forecast Technical Analysis
17:14 Nvidia Stock NVDA Forecast Technical Analysis
18:10 Apple Stock AAPL Forecast Technical Analysis
19:00 Amazon Stock AMZN Forecast Technical Analysis
19:59 Google Stock GOOGL Forecast Technical Analysis
21:43 Microsoft Stock MSFT Forecast Technical Analysis
24:09 Meta Forecast Technical Analysis

GOOGLE: Next stop --> All Time High.Google maintains one of the steadiest trends of the year as not only does it remain on smooth bullish 1D technicals (RSI = 57.789, MACD = 1.700, ADX = 30.881) due to Channel Up 2 since June, but also it maintains Channel Up 1 since the start of the year. The 1D MACD indicates that the stock price has entered a 2 week consolidation phase, whose next leg up would be at least +20.52%, which is marginally over the All Time High (TP = 152.30).
## If you like our free content follow our profile to get more daily ideas. ##
## Comments and likes are greatly appreciated. ##

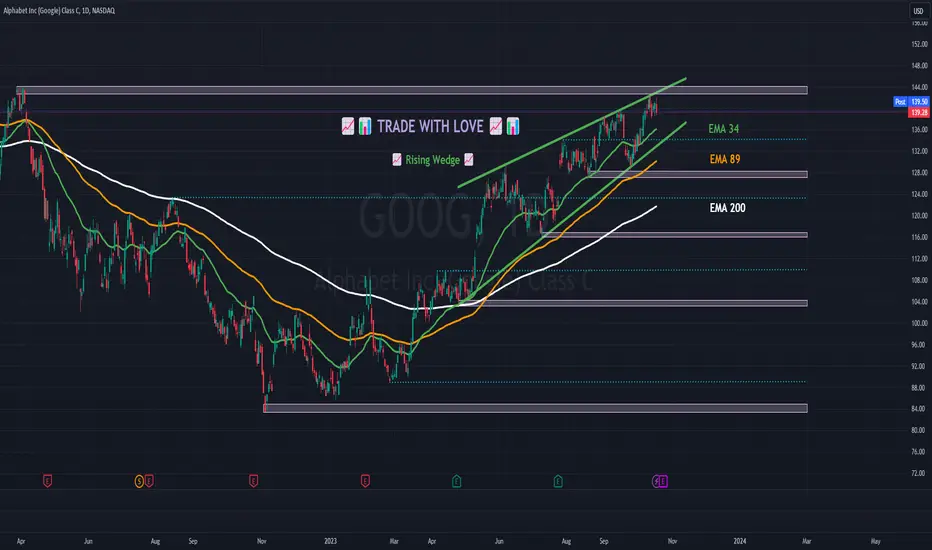
📈📊 #ChartPattern Alert! 📈📊 📈 Rising Wedge 📈📈 What is a Rising Wedge? The Rising Wedge is a bearish chart pattern characterized by two converging trendlines, with the lower trendline sloping upward more than the upper trendline. It typically signals a potential bearish reversal, with the price likely to break downward after the wedge pattern.
📈 How to Identify:
Draw a trendline connecting at least two lower highs (upper trendline).
Draw another trendline connecting at least two lower lows (lower trendline).
📈 What it Signals: The Rising Wedge suggests a potential bearish reversal, with sellers prevailing at lower highs within the wedge. It often forms during uptrends and can precede a significant price move to the downside.
📈 Trade Strategy:
Consider short-selling or setting stop-loss levels if the price breaks below the lower trendline of the Rising Wedge.
Set profit targets based on the pattern's height subtracted from the breakdown point.
Implement a stop-loss to manage risk in case of a false breakdown.
Remember to use other technical indicators and conduct thorough research to support your analysis before making any trading decisions. Happy charting and trading! 📉💹
$Googl - 15 min
2 steps for Bullish Scenario with T1S Indicator:
1. Candles Above the Green Line:
• Check that the candles on the chart are positioned above the green line of the T1S indicator. This could be an indication of bullish momentum.
2. Bars Above Zero:
• Ensure that the bars on the T1S indicator are above zero. This condition might suggest positive market sentiment or upward price movement.
2 steps for Bearish Scenario with T1S Indicator:
1. Candles Below the Green Line:
• Verify that the candles on the chart are positioned below the green line of the T1S indicator. This condition may indicate bearish momentum or a potential downward trend.
2. Bars Negative Below Zero:
• Confirm that the bars on the T1S indicator are in the negative territory and located below zero. This setup suggests a negative market sentiment or downward price movement.

RISING WEDGEPrice fell from the 1st rising wedge by breaking the bottom line, but recovered quickly and is now back above the bottom line of the 1st rising wedge.
Another, smaller wedge has formed and price is inside.
Rising Wedges are known to be bearish and can represent too much supply inside the wedge, causing a sell off when the wedge is triggered by breaking the bottom line which is support until broken. This pattern is not valid until the bottom line is broken. Sometimes price can break to the upside from this patter, but in the end the wedge will be broken. This can be a long term pattern.
Both lines slope up and narrow at the apex.
Large cup pattern also noted with EL at 152.20.
Earnings estimated to be on 10-24.
NO RECOMMENDATION

Google and Cambridge renew multi-year partnershipCambridge University and Google have forged a renewed, multi-year partnership aimed at funding and conducting groundbreaking research in the realm of artificial intelligence.
Their focus will be directed towards pressing concerns such as climate, healthcare, security, and the ethical deployment of emerging technologies.
Michele Donelan, the Secretary of State for Science, Innovation, and Technology, has officially confirmed this:
"Artificial intelligence can offer us enormous opportunities - growing the economy, creating new jobs and making lives longer, healthier and happier for British people."
The Magnificent 7 Index : A House of CardsThere are exactly 7 stocks holding up the entire US stock market. Those assets include Alphabet, Amazon, Apple, Meta, Microsoft, Nvidia, and Tesla. What I’ve done here is created an index chart that enables an Elliott Wave count of all 7 assets combined. The all time high was printed in November 2021, along with the rest of the major stock indexes. Since then, these magnificent 7 have carved out a 5 wave expanding diagonal decline, followed by a 3 wave corrective zigzag that ended in July 2023. This is an incredible 1-2 series to begin a massive decline to an all time low below $170 for an index currently valued around $1800. But let’s not put the cart before the horse and instead look at what’s right in front of us. Since the wave 2 high in July, this house of cards has begun to tumble, printing a smaller degree 1-2 decline that is only the beginning of a much bigger fall described in this post.


Google: Bearish Deep Crab Dark Cloud Cover Type 2 Return EntryGoogle, after its initial bearish reaction to the PCZ, has returned to the PCZ as the RSI managed to make a 3rd lower high and is set up to give us an impulsive move downwards in the coming days. We also confirmed a textbook Dark Cloud Cover today after the rejection of the ascending trend line.
I think we will see extreme downside from Google pretty soon that will undo most, if not all of its 2023 upside price action.

GooglRising wedge here and a dark cloud cover daily candle.
Targets are
138 gap close.
Below 138 and we head straight for our 21ema at 135
Below 135 and 130-132 at play here..
Daily Rsi just hit our reversal
XLC sector which is the sector of Meta,googl, and NfLX just hit its supply zone with a bearish engulfing

GOOG: Darvas would have been super excitedThe leader is back!
This is one of the prettiest charts to look at.. and GOOG is a main component of my portfolio.
an interesting observation on super big volume trading days is that most of them recently are associated with days where the price didn't break the prior bar's low .. this is a good sign of accumulation. big money buying in relative short-term weakness ?
Watching for another level up and a breakout to new range above $140.0 - maybe this week's macros can be the catalyst ?

I am looking on a bullish continuation on GOOG.
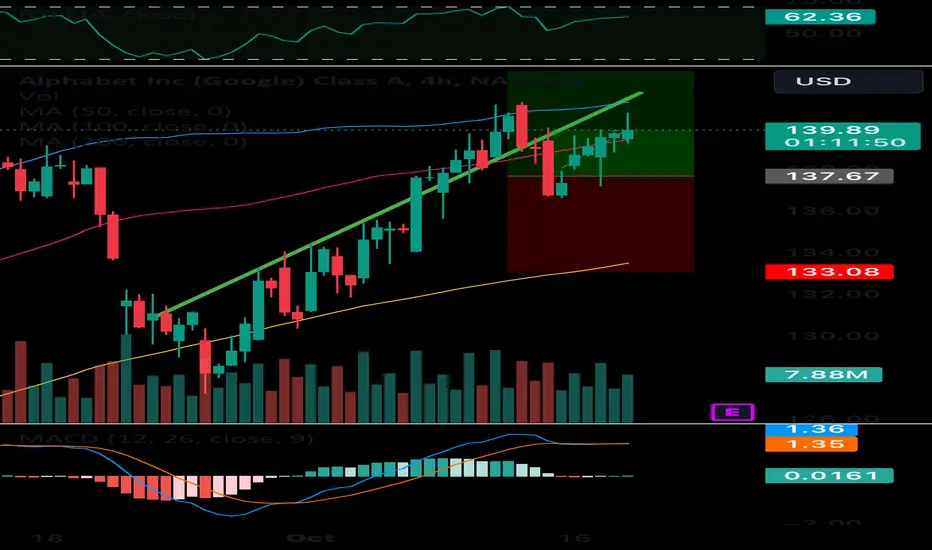
As you can see here we have formed a couple of trendlines on the 4 hour chart. And If we can break the 139.97 level, we could possibly see a continuation on google. We also are above VWAP. And seeing that we have good momentum on my indicators I believe that we could see that very soon possible tomorrow. I would be looking for a breakout on the 5 minute chart for the perfect entry.

Confirming the buying Signal on alphabet Google I would like to revisit my analysis on Alphabet (Google) stock that I posted nearly a month ago and confirm it for three reasons:
1) After the market tested the trendline, it returned strongly to its bullish trend with significant momentum.
2) We are observing an increase in volume following the test of the trendline, indicating that buyers are stepping in, and they are likely to push the market towards its resistance level of $151.
3) As we can see, the market is respecting the pitchfork levels, so there is no reason to sell. The market should continue its bullish trend until it reaches $151.
Thank you for reading, and I'll see you soon."


GOOGLBroke down out of rising wedge & retraced back up to monthly supply. Currently rejecting. Not a bad short against the September highs imo.
GooGleI see bear . The retracement is way too high tho...
That is my current perspective and i am ready to be wrong. But shorting these areas wouldnt be a bad idea.
In ending contracting diagonals , every incoming wave should be smaller then the previous one.
Stay tuned, will count this beast...

GOOG Short - B wave completionLook for the B wave completion in the next few days. If this happens it would be good for a short down to $131. I would grab an option 2 Fridays out once this is confirmed.

GOOG - TREND REVERSAL SCENARIOA U.S. Justice Department lawyer questioned a Google executive in an antitrust trial about the company's tactics for increasing online advertising prices. Google's Vice President of Product Management, Adam Juda, testified that the company uses a formula involving ad quality to determine auction winners for website advertising. The Justice Department alleges that Google manipulates these formulas to benefit its own profits, a claim Juda disputed. He acknowledged that adjustments to the formula can impact pricing. Google has faced criticism for its lack of advertising transparency, with advertisers and website publishers accusing the company of taking too much revenue. This testimony shifts focus from Google's expenditures to maintain its search engine as the default on devices.
Risk Disclosure: Trading Foreign Exchange (Forex) and Contracts of Difference (CFD's) carries a high level of risk. By registering and signing up, any client affirms their understanding of their own personal accountability for all transactions performed within their account and recognizes the risks associated with trading on such markets and on such sites. Furthermore, one understands that the company carries zero influence over transactions, markets, and trading signals, therefore, cannot be held liable nor guarantee any profits or losses.

Resistance OverheadGOOG fell from a bearish rising wedge.
Price appears to have hit support and recovered.
There is a structure forming but too soon to call it.
The bottom blue line of this structure and until the top or bottom line is broken, this possible pennant is neutral.
There is also a large cup but it is a ways to EL for the cup pattern.
No recommendation

