IBM trade ideas

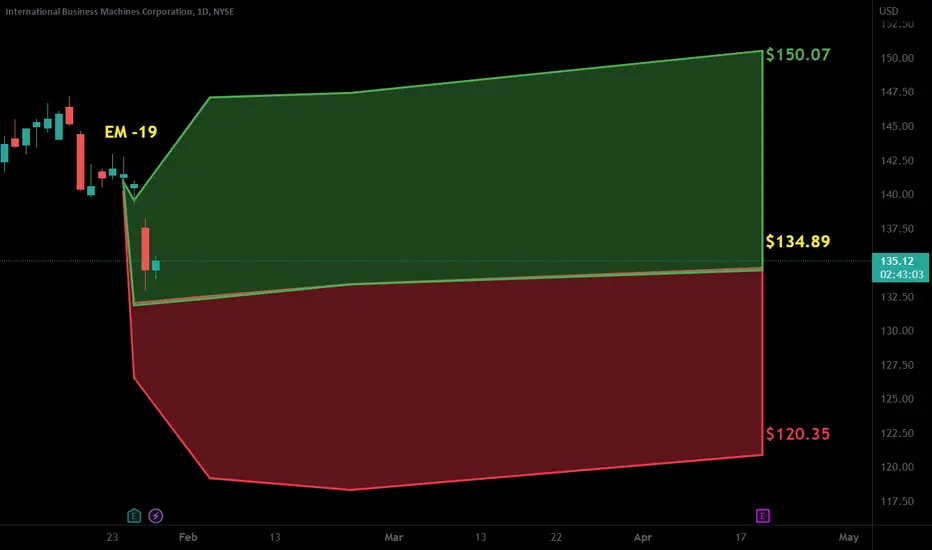
IBM daily bearish hammer end of wave 5 expect ABC correctionOrder SELL IBM NYSE Stop 136.56 LMT 136.56 will be automatically canceled at 20230401 01:00:00 EST
IBM daily bearish hammer end of wave 5 expect ABC correction at least.

ABC/DPossible stop under c or under the 50% pull back level.
The target is D and when D is reached, then a pull back or reversal is expected.
No recommendation.
Earnings estimated to be on 4-18 and most analysts appear to have a negative forecast.
EPS (FWD)
9.48
PE (FWD)
13.69
Div Rate (FWD)
$6.60
Yield (FWD)
5.09%
Short Interest
2.84%
Market Cap
$117.66B

IBM Stock Chart Fibonacci Analysis 032723 Trading Idea
1) Find a FIBO slingshot
2) Check FIBO 61.80% level
3) Entry Point > 130/61.80%

IBM - New Buy Recommendation, $128.55, Target $2400. Notes to follow;
1. IBM looking to breakout soon;
2. Talking about the "IBM Corridor" and other initiatives below;

IBM long term set upthe set up should speak for itself. broke trend line to the upside, with a pull back to retest trendline BULLISH

IBM TO 125 is a buy Wait for a retracement of IBM to 125$ . Any thing below is a buy and will go back to 140$ by 2024. 11% plus gains possibility

Bear FlagFlags are neutral patterns whether the pole is up or down.
Rising wedge at the top that has long since corrected coupled with an RSI diversion at the top. If these 2 technical technical patterns happen at a top, it is usually the top and time to run.
This one is Down and it appears IBM is going with the flow of a downward break from classic bear flag.
No recommendation/It can be more difficult to call a top than a bottom in my experience as bullishness will persist until the security is so over extended, it can be almost daunting.
For a bear flag, I take the pole and project it up or down in the opposite direction of where the flag is heading, I also use the opposite trendline. IE if it breaking down, if use the top trendline of the flag and project the pole down from that point.
There are different ways to calculate flag targets and we are all different.
M pattern may ne in formation which influence my targets. Good luck.


ibm analysis from a statistical perspectiveOn January 2017, IBM had a adj.close price of $124.89. On January 2023, ibm had a price of $133.09. This is obviously a mature company and doesn't currently see huge consistent growth at this point. The best approach would be a fundamental value play as opposed to statistical mean reversion. IBM has an expected average monthly return of 0.35%, with a 4.35% arithmetic annual average and a 1% geometric annual average return on your money. IBM currently has a 6.27% Required return and it currently doesn't make beyond that annually as stated by the geo annual average. That metric basically means that you're better off purchasing an index as opposed to owning this stock. However, that doesn't mean there isnt any opportunity. It has low volatility at 7.48% currently. I personally wouldn't buy this due to its lack of growth in stock price, and the other factors previously mentioned, but if you can anticipate the business decisions that they'll make, which may potentially change their position in the industry, then i say this is worth looking into from that perspective.
However i will state that the simple valuation i calculated values IBM at $160.83 even after everything i mentioned. Safe trading folks!

Don’t sleep on IBMJust retesting a longterm breakout
In a clear uptrend
50% retrace from recent highs versus October 22 lows, which was a divergent low
AI
Hybrid Cloud
Edge Cloud
Quantum Computing
Digital Twins
R/R 15% downside vs 150% upside, stop below October 22 Low
G R Industry 4

#IBM weekly long ideaHello dear Traders,
Here is my idea for #IBM
Price closed above yellow line
Targets marked in the chart
Invalidation level marked with red line
IV30 % Rank: 3% Subdued
Good luck!
❤️Please feel free to ask any question in comments. I will try to answer all! Thank you.
Please, support my work with like, thank you!❤️

IBM Bullish CallIBM Bullish Call
IBM topped its fourth-quarter earnings estimates
Current dividend yield of 4.7%
Double-digit percentage revenue growth

Ole' boring IBM an unsung hero with a measly market cap of apx $123B. Is ready to move up.
I was hoping to add more in the green box but it never came. Regardless it seems to have been in a long consolidation respecting supports as it works its way up.
There should be plenty of opportunities to get in as I believe we are going to break ATH over the next many months to years. first target around $170.

Big BlueThe Great Reset applies to the corporate world as much as geopolitics and society
The elites believe in rebirth
As such this is another stonk I believe is about to rise like the phoenix
With IBM Watson, IBM hybrid cloud, quantum computing and IBM impact (ESG) I believe reports of this juggernaut’s demise are premature
On the chart I have 5 pivots up and 5 pivots down over decades
I believe it has been in an uptrend since prior to the plandemic which will take it to aths and beyond
Send it
GRI 2023

Great Reset Investing: The Industry 4 Index The great tranny-sition from Industry 3 to 4 is upon us
What’s cute is they’re going to take these beaten down stonks and work their cheat sheet magick whilst you’re left hodling your Google bags at the top
Industry 4 needs web 3 software, next generation wireless tech and edge enabled hardware; and ofc quantum computing
Of all the biggest tech I can see only Meta (web 3/ metaverse/ crypto) and Tesla (ai/robotics/Elon) keeping up
But value wise these are I believe da bestest
GRI 4.0

IBM - Longer Term Short TradeThis stock was brought to my attention by one of my followers requesting my opinion.
WEEKLY Linear chart...
This looks juicy ..... I believe this is poised for a substantial drop. Capable of producing a return over 50%.
Longer term put option or a LEAP may be in order here.
I believe we have just completed the "B" wave on a long term Elliot Wave sequence. The target price will bring us back to the wave 4 termination in the mid $60 range.
A price move over the descending white channel line into the $160 range should be used as a stop. Good risk-reward at this point!

IBM looks ready to breakout of a 10 year downtrend IBM looks ready to breakout of a 10 year downtrend
They’ve spun off their excess baggage
As big tech goes should be ok for Industry 4
GRI 2023

Crooked MPossible bat.
The 4th leg of this pattern terminates at the .886 or in some cases, the 1.113 of the first leg up. If it goes to the 1.113 it is an Alternate Bat Pattern.
No recommendation

$IBM with a Bearish outlook following its earnings #Stocks The PEAD projected a Bearish outlook for $IBM after a Negative Under reaction following its earnings release placing the stock in drift D with an expected accuracy of 84.62%.
Watchlist 2023-01-26 #LEVI #IBM #XRX #CVX #RUNSPY found support early in yesterday's session at the important 393.66 level. Then shorts failed to keep control for the remainder of the day. Key pivot level today is 402.63. After that, there is little resistance to the last CPI high at 410.20 from Oct 13. Bias Is high but the market loves fadeouts so be sure to watch for high volume reversals after breaking key levels.
LEVI - Breaking out of a monthly range. I it can hold the 17.50 area, which is the pivot high and the 200 day, we could see it higher to 18. However, since it's up 2 ATRs in the PM, the better risk reward trade is a gap n go from 17 IMO.
IBM - Looking weak AF after earnings. 137.30 pivot ideal spot to sell. Wait and see trade, if it looks incredibly we can get in early with target to 200 EMA at 134.38.
XRX - Conversely with a double earnings beat and modest guidance. Double top turning into support and 17.57 is ideal zone to enter on strength. 18 isn't a very clear target so PM high is likely the best zone to sell.
Other watchers:
CVX - dividend increase and a massive 75B share buyback.
RUN - after yesterday's capitulation


IBM D3 - Bearish Quasimodo Pattern on D3“Discipline is only difficult when you look at it as something unenjoyable. When you re-frame cutting losses and celebrate avoiding a large loss and freeing up capital for a better trade, suddenly having discipline becomes second nature and being undisciplined becomes painful.” ~Mark Minervini~
