Swing & Positional Trading and Stock Options Setup _ High Beta✅ Final Setup for Positional and Swing Trades (High Beta Liquid Stocks for Cash and Options)
This trading guide outlines a simple and effective setup for both positional and swing trades, focused on high beta, highly liquid stocks. Follow the rules strictly for better consistency and profitability.
800 ARS
3.06 T ARS
18.69 T ARS
About INFOSYS LTD
Sector
Industry
CEO
Salil S. Parekh
Website
Headquarters
Bangalore
Founded
1981
ISIN
ARDEUT113941
FIGI
BBG000PZ2494
Infosys Limited is engaged in consulting, technology, outsourcing and next-generation services. The Company, along with its subsidiaries, provides business information technology services comprising application development and maintenance, independent validation, infrastructure management, engineering services comprising product engineering and life cycle solutions and business process management; consulting and systems integration services comprising consulting, enterprise solutions, systems integration and advanced technologies; products, business platforms and solutions to accelerate intellectual property-led innovation, including Finacle, its banking solution, and offerings in the areas of Analytics, Cloud and Digital Transformation. Its segments are Financial Services and Insurance (FSI), Manufacturing and Hi-tech (MFG & Hi-TECH), Energy & utilities, Communication and Services (ECS), Retail, Consumer packaged goods and Logistics (RCL), and Life Sciences and Healthcare (LSH).
Related stocks
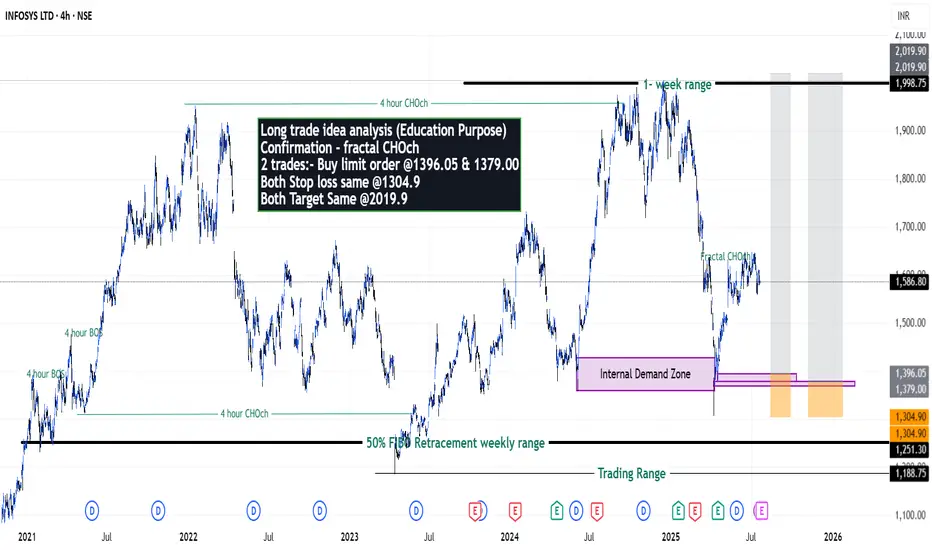
Infosys on getting ready for new high? - {20/07/2025}Educational Analysis says that Infosys (Indian Stock) may give trend Trading opportunities from this range, according to my technical analysis.
Broker - NA
So, my analysis is based on a top-down approach from weekly to trend range to internal trend range.
So my analysis comprises of two structures:
Gan Fan analysis of InfyGan Fan Line for infy the Gan Fan analysis for the infy has become so much important at this stage to make a long term decision watch the video till end


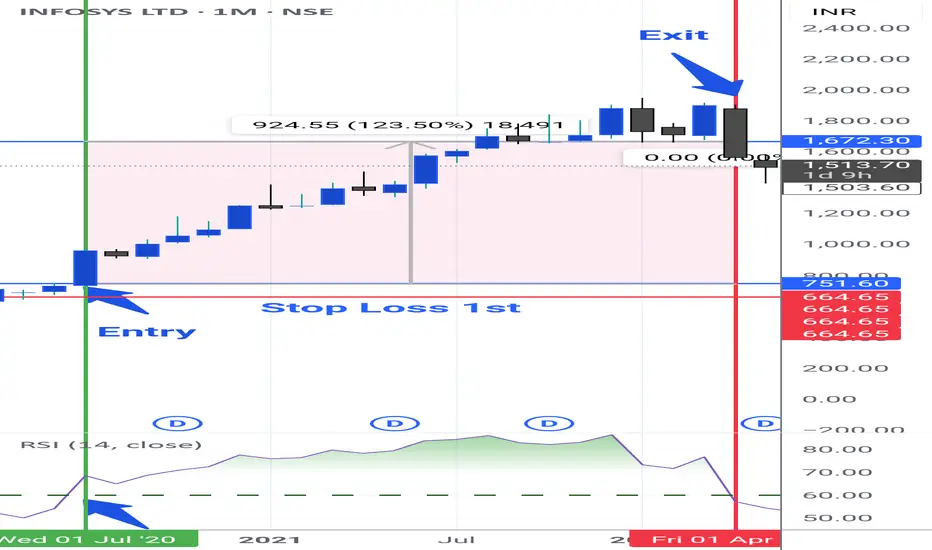
Looking to buy infosys when the range of 1650 gets broken...looking to buy infosys when the price of 1650 get broken decisively..
it can give good returns,final target oF 1960-1970..
it's a complete swing trade

InfyWhenever marked structure is broken on upper side infy can give good risk to reward trade. However no one knows how much further consolidation can happen.It has slowly started making positive price action above lower time frame 200 ema.
This is just for education and no buying or selling recommendat
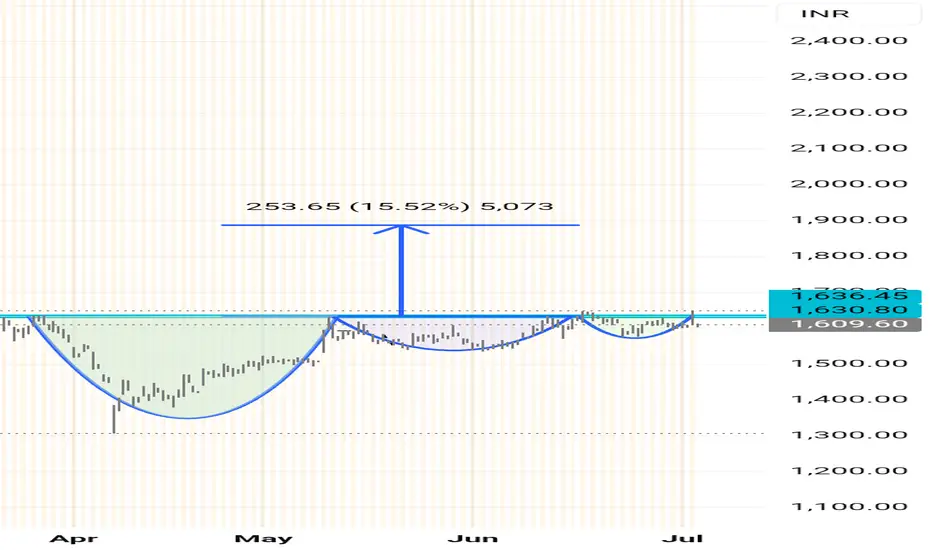
INFOSYS 📊 Chart Analysis – Infosys Ltd (INFY)
Currently, the stock is testing a key resistance zone between ₹1620–₹1630.
If the price breaks and closes above this resistance, it can signal a strong bullish breakout.
---
💼 Trade Setup (Based on Cup and Handle Pattern):
Entry (Buy): On a closing above ₹

INFY_Neutral to Long- Price near one of the Resistances.
- Price has not broke out; However it showed good strength with big green candle
- Wait till how the next 2 days are going to be .

INFY | Buy @LTP | SL below 1525 | Targets 1880, 2000Disclaimer:
This is not financial advice. Please do your own research or consult with a financial advisor before making any investment decisions. Investments in stocks can be risky and may result in loss of capital.

Infy Bullish Infy 1563 is showing signs of bullish for target 1620. Support 1549.
Currently Undervalued and has potential to target 1833.

See all ideas
Summarizing what the indicators are suggesting.
Oscillators
Neutral
SellBuy
Strong sellStrong buy
Strong sellSellNeutralBuyStrong buy
Oscillators
Neutral
SellBuy
Strong sellStrong buy
Strong sellSellNeutralBuyStrong buy
Summary
Neutral
SellBuy
Strong sellStrong buy
Strong sellSellNeutralBuyStrong buy
Summary
Neutral
SellBuy
Strong sellStrong buy
Strong sellSellNeutralBuyStrong buy
Summary
Neutral
SellBuy
Strong sellStrong buy
Strong sellSellNeutralBuyStrong buy
Moving Averages
Neutral
SellBuy
Strong sellStrong buy
Strong sellSellNeutralBuyStrong buy
Moving Averages
Neutral
SellBuy
Strong sellStrong buy
Strong sellSellNeutralBuyStrong buy
Displays a symbol's price movements over previous years to identify recurring trends.
Curated watchlists where INFY is featured.

Indian stocks: Racing ahead
46 No. of Symbols
See all sparks