Looks very strongPrice is oversold in the weekly timeframe and has already bounced off twice the strong support with lots of volume the two times. Is very early to tell if is forming a double bottom, but it looks that market doesn't want the price to go lower under the support. This a long term holding, maybe a couple of years but the risk reward is too good to ignore it. On the other hand, check my previous post lines below on AVGO, another chip maker.
INTC trade ideas

DONT SWIM AGAINST THE CURRENTTHIS IS INSANE - Technically speaking the market in general is in a downtrend. a recession or correction. it should not matter. what is insane is am taking a Long trade on such a downtrend market. As any trading Guru would say " dont swim against the Current " dont trade against the trend. But I did. well I make exceptions. let me explain.
The Long-term(M) is in a downtrend. the price is coming strongly overselling into a fresh DZ. I set my ENTR at 27.xx with STP-LOSS below the DZ; small risk with plenty room for profit to run. my risk to reward ratio adds up. I always calculate my estimates Rs (risk) before I calculate my estimated Rw (Reward)
When price enters the DZ: there are three possible outcomes;
- Trend Reversal - The DZ will hold & trend changes. Big win & small Loss
- Correction - The DZ will hold for sometime, giving small win and small Loss
- Breakthrough - The DZ does not hold at all, giving a small loss; I am OK taking that small loss; it is within my trade plan
What I was looking for was a correction, happy to take this small Long profit in such a downtrend market. to do this type of trade & swim against the current one much be very vigilant; tight STP loss is key.
What I did here, price entered the DZ, the correction began; I covered 1/2 of my position; I took $3 of each share, & let the rest (other 1/2) run; sadly but predictably, the correction lost momentum in a heavily bearish market. I readjusted my STP LOSS to exit trade at breaking even.

Fast In Fast Out ShortCandle is stuck in the cloud. Snatch a couple of short bucks for the next few days.

INTC Headed LowerBumping up against resistance at the .328 fib resistance level, Expect next leg down to test the -0.236 fib around 20.

Bullish Spike on Intel (INTC)This morning's 10am scan yielded bullish price action spikes on both AMD and INTC. I like the level that Intel NASDAQ:INTC is holding to for a swing trade. The first target will be a retest of this week's high.
In the longer term after a very long bearish trend the chip makers have begun to turn. It is somewhat "late" in the turn from October but there are now confirmed signs of a possible reversal. Daily chart:

INTEL is only up from hereindicators show a likely bottom here,
computers aren't going anywhere and INTEL is still the leader in chip manufacturing despite their issues loosing the patent lawsuit.
INTEL in for a major comeback.
RSI and MACD bottomed out,
dropping lower to 14$ possible but unlikely, most likely this is bottom and only up from here

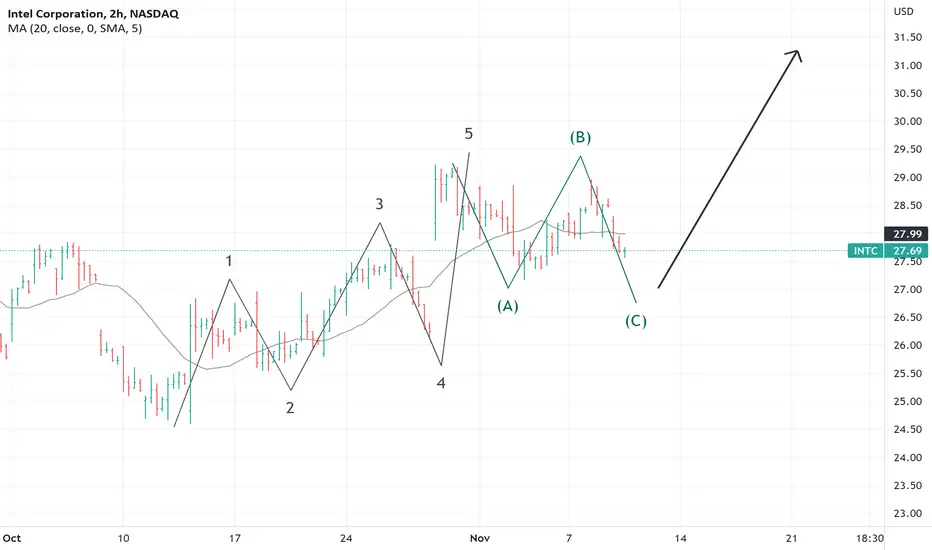
INTL - Higher Highs Ahead?Coming in from a Bullish Market standpoint, Intel may be setting up for a big rally. Following the A-B-C correction, INTL would move into a wave 3, pushing for much higher prices.
INTC daily wave 2 of uptrendINTC daily wave 2 of uptrend probably I'm already in you can move your entry above next day candle if it closes above today's doji and completes morning star reversal.

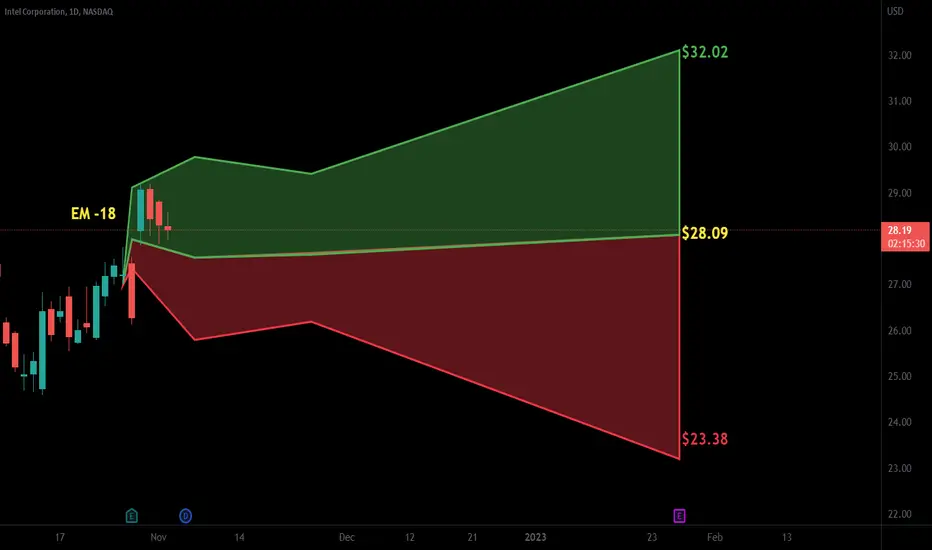
$INTC with a Bullish outlook following its earnings #Stocks The PEAD projected a Bullish outlook for $INTC after a Negative over reaction following its earnings release placing the stock in drift A with an expected accuracy of 66.67%.

That's Why I am Keep saying "INTC" is very interesting right now
As What I posted on Oct 26th, I think INTC is very interesting right now, and INTC's earning proved what I was saying.
As reported, "Intel shares rose as much as 7% in after-hours trading Thursday even though the semiconductor giant gave a revenue outlook that suggested sales are slowing down heading into the end of the year. Intel (INTC) said that for its current, fiscal fourth, quarter it expects to earn $0.20 a share, excluding one-time items, on revenue of between $14B and $15B. That outlook suggests that Intel's (INTC) sales could fall as much as 31% from the fourth quarter of 2021.The company also lowered its full-year revenue estimate to a range of $63B to $64B, from an earlier forecast of $65B to $68B in sales. While its forecasts left something to be desired, Intel (INTC) reported third-quarter earnings that surpassed Wall Street's expectations. Intel said that it earned $0.59 a share, excluding one-time items, on revenue of $15.3B for the quarter ending September 30. Analysts had earlier forecast that Intel (INTC) would earn $0.33 a share on $15.3B in revenue. During the year-ago period, Intel (INTC) earned $1.45 a share on revenue of $18.1B. It was a rough quarter for Intel , as sales in its main business areas declined from a year ago. For its main business areas, Intel's client computing group, which includes sales of chips and technology for consumers and businesses, turned in revenue of $8.1B, down 17% from the third quarter in 2021, and data center sales of $4.2B, which fell 27%. Chief Executive Pat Gelsinger said in a statement that "despite worsening economic conditions," Intel "made significant progress with our product and process execution" during the quarter."
The market is already celebrating the results (up 7%), but I see this as an oversold bounce that will fix itself. Mobileye Global Inc. has raised very little cash for the company and won't change trajectory of things. Look lower for a buy point and be prepared to say farewell to that fat yield!
HOLD INTC if you can!
The investments and idea published may not be suitable for all investors. If you have any doubts as to the merits of an investment, you should seek advice from independent financial advisor or other professionals to determine what may be best for your individual needs. We do not and cannot guarantee that your use of our APP and/or any of its features will generate profits. All opinions, news, reviews, research, analysis, prices, or other information contained on or provided via this site are provided on an “as is” basis as general market commentary and/or expressions of opinion only. Information may not be complete, accurate or up to date and may not be suitable for every individual, nor be a suitable basis for an investment decision. No representation, warranty, undertaking, assurance or guarantee (express or implied) is made or given as to the availability, adequacy, accuracy, completeness, reasonableness or appropriateness of any of the information or opinions provided or expressed on or through this site. There is no obligation to notify you of any corrections or modifications.

Buying Intel..?Intel Corporation - 30d expiry - We look to Buy a break of 28.02 (stop at 25.88)
We are trading at oversold extremes.
In our opinion this stock is undervalued.
Price action has posted a Doji candle and signals a possible reversal of the recent trend.
The RSI is trending higher.
Bullish divergence is expected to support prices.
We need to see a break of bespoke resistance (at 28.00) to confirm the positive outlook.
Our profit targets will be 33.69 and 36.69
Resistance: 27.00 / 28.00 / 30.00
Support: 25.50 / 24.50 / 23.00
Disclaimer – Saxo Bank Group.
Please be reminded – you alone are responsible for your trading – both gains and losses. There is a very high degree of risk involved in trading. The technical analysis , like any and all indicators, strategies, columns, articles and other features accessible on/though this site (including those from Signal Centre) are for informational purposes only and should not be construed as investment advice by you. Such technical analysis are believed to be obtained from sources believed to be reliable, but not warrant their respective completeness or accuracy, or warrant any results from the use of the information. Your use of the technical analysis , as would also your use of any and all mentioned indicators, strategies, columns, articles and all other features, is entirely at your own risk and it is your sole responsibility to evaluate the accuracy, completeness and usefulness (including suitability) of the information. You should assess the risk of any trade with your financial adviser and make your own independent decision(s) regarding any tradable products which may be the subject matter of the technical analysis or any of the said indicators, strategies, columns, articles and all other features.
Please also be reminded that if despite the above, any of the said technical analysis (or any of the said indicators, strategies, columns, articles and other features accessible on/through this site) is found to be advisory or a recommendation; and not merely informational in nature, the same is in any event provided with the intention of being for general circulation and availability only. As such it is not intended to and does not form part of any offer or recommendation directed at you specifically, or have any regard to the investment objectives, financial situation or needs of yourself or any other specific person. Before committing to a trade or investment therefore, please seek advice from a financial or other professional adviser regarding the suitability of the product for you and (where available) read the relevant product offer/description documents, including the risk disclosures. If you do not wish to seek such financial advice, please still exercise your mind and consider carefully whether the product is suitable for you because you alone remain responsible for your trading – both gains and losses.

INTC: Starting to look attractiveIntel has been trading in a range for over two decades. Most recently, INTC has fallen below below its Value Area High, and will most likely tank ~20% to tag it's VPOC at $21.4 which falls in between the Golden Pocket before a significant bounce. Let's see where INTC will be at when SPX is around ~3,200.
Monthly RSI is now oversold for the 1st time in INTC's history. INTC is starting to look attractive.

Intel major swing Yesterday's CPI print was negative however it is very possible that the market is expecting lower CPI in the coming months and risk assets to be bid until then.
Intel is one of my top picks as it is at extremes on quarterly levels. I expect prices appreciate to 40$ range in the coming months.

INTC in Descending Falling WedgeNASDAQ:INTC Trading the breakout so going to keep very close track of it during premarket.
Mitigate your risk.
*Not Financial Advice


INTC Day Trade IdeaINTC 30 min in an ascending wedge, I'm not playing the consolidation, I'm going to trade the breakout. NASDAQ:INTC

Intel is also visiting multi decade support around 25$Prime time for a bounce.
Disclaimer : Not a financial advice

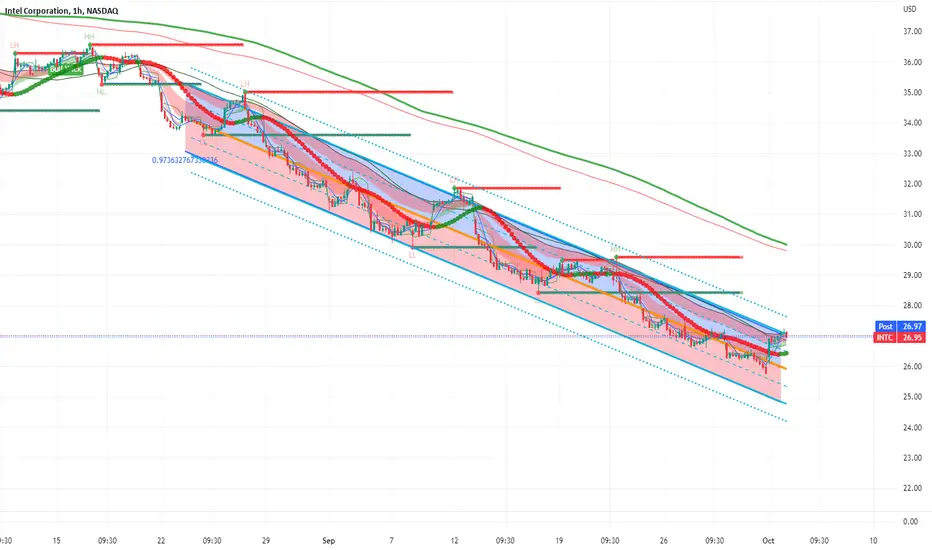
$INTC regression trend, Intel $INTC regression trend, Intel
Lets see if it breaks the trend in October as we turn a bit bullish
Intel up 4%, files to IPO its Mobileye self driving car divisionApparently, Intel has an ace up its sleeve. It owns a self driving car division called Mobileye and seeks to file for IPO. Mobileye valuation could range between 30-50 billion, while current market cap on Intel is around 100billion.

INTC stonks under 4th Elliott's wave This is an update regarding last update for INTC stonks. In M1 we can easily see 4th Elliott's wave begins, so I recommend to wait till 5th wave for some buys

Massive drops incoming on Intel. INTCIndeed. Check out that epic gap and we are about to crash through the most recent low set in July. Fractally ~ zigzag nearing completion.
We are not in the business of getting every prediction right, no one ever does and that is not the aim of the game. The Fibonacci targets are highlighted in purple with invalidation in red. Confirmation level, where relevant, is a pink dotted, finite line. Fibonacci goals, it is prudent to suggest, are nothing more than mere fractally evident and therefore statistically likely levels that the market will go to. Having said that, the market will always do what it wants and always has a mind of its own. Therefore, none of this is financial advice, so do your own research and rely only on your own analysis. Trading is a true one man sport. Good luck out there and stay safe.

INTC - Good Entry PointA Chart for intel
Red line shows a strong trend line that extends through two bull periods
From this red line we can develop a channel that shows a point of support for price at the middle line of this channel, at around $20
Bearish until middle line hit and trend reversal is apparent
