JPMORGAN CHASE & CO Opportunity DailyHey my friends, JPMORGAN CHASE & CO is in a bullish momentum with hammer bull candle and stable buy volume executed. On the TIMEFRAME 1Min we see a bearish collapse which starts at its last low point and turns to go up. So this JPMORGAN CHASE & CO situation is going to its next high if the buyers are still there, we can arrive on the next high. But before a big resistance to pass for the moment, no buying power to go on this one.
Please LIKE & FOLLOW, thank you!
JPM trade ideas

017. PIGGISH PLAY - Short JPMorgan Chase (JPM)It is no secret that the Banking Sector is getting killed these days. Rightfully so.
With USD being printed at a pace that refutes the phrase "Money Doesn't Grow on Trees" and recent liquidity/lending regulations being imposed, it is difficult to see any sort of banking institution thriving at the present moment. Simply put, banks are now required to hold vast reserves of USD that is continuously depreciating in value, while also trying to conduct business in a (nearly) interest-free environment. To be honest, it is a pretty unfair situation and I offer my sympathies.
Yet, I will contribute towards shorting them into nothingness because that is what the market wants.
Onto the Pig Play:
The chart clearly demonstrates that JPM's historical quarterly earnings have little to no correlation with near-term price movement. This is good because it is the main reason why the premiums on near-term put options are priced at such a bargain. Bottom-line-performance and derivative pricing aside, this upcoming report is monumentally important for the entire broader economy, and all eyes will be fixated on the guidance offered on Tuesday morning. I'd even say that JPM's guidance is more meaningful than that of the FED because it is perceived as a more honest take on the economy.
To this end, JPM has reiterated bearish guidance during both of their prior 2020 quarterly conference calls.
I am speculating two things to occur on Tuesday; both of which serve as an impetus for this short setup:
1) JPM will miss their projected revs/earnings harder than they ever have for the reasoning outlined in the second paragraph
2) JPM will offer its most bearish guidance to a) justify its horrendous numbers, b) because the economy is not improving much, and c) because everyone expected the economy to be improved much
Technical impetus derives from the clearly bearish channel that emerged from the initial impulse wave down in February, the near-perfect bearish harmonic that will likely complete its "D" on Monday (if the market finishes its expected final leg up before the mighty selloff), and the decreasing highs of what seems to be a fading triple top on the daily timeframe.
Plan for Monday:
1) Accumulate puts toward the end of the morning session with a strike range between 96 - 99 and an expiration range of 10/23 - 10/30
2) For this play, I will have two separate positions for a more aggressive short term play (i.e. 96 Strike, 10/23) and a more conservative play (99, 10/30)
3) The majority of my position will be weighted towards the conservative play because of my general outlook that the market will crash and continue steeply downward for at least a few weeks thereafter
4) For those who want a decent hedge, buying 10/23 BlackRock calls might be a good idea. If JPM somehow beats strongly and issues bullish guidance (>1% chance, IMO), then having a similar, but better, company's calls that are set to report later in the week will inevitably catch a big bid.
Last thing - it might just be that Tuesday's guidance will be the straw that breaks the market camel's back and augments the crash setup. I suspect that the driving reason for the lack of market selloff (from institutions) so far is this scheduled report. In any case, if this does "cause" the broad selloff, then having a short position beforehand is like having your cake, ordering another cake, and eating both of them simultaneously.
Good luck and crush this play.
- Bank Piggy
NYSE:JPM
NYSE:WFC
NYSE:BLK
SPCFD:SPX
AMEX:KBE

JPM LOTS of resistance aboveJPM seems to be on the rise but its got a lot of resistance to break to the upside. Considering how weak the banking sector has been compared to other sectors. im guessing we will not break resistance. But lets wait and see.

JPM - on weekly watch list for post-earnings tradeAfter the Feb-Mar drop in price, this stock has been in a rising consolidation since. Price recently broke red dashed support line and has come up near it.
After earnings, price can easily move $10 in either direction. One caution though, buyers could also come in on a price drop since this earnings may be weak but there is expectation for bank stocks to rise with inflation.

jpm can go either way hereall banks seem range bound in general. a lot of better options in my opinion, I wouldn't touch this unless it broke out :) goodluck

JP Morgan Chase 1 DayArea of support and resistance at 105.51 has been tested multiple times so I do expect prices to go up and reverse back down


JPM-It's in the charts--mini-double bottom break-outs I think this is a likely scenario---JPM typically forms small double bottom (Adam/Eve, Adam/Adam etc.) right before breakout to a change to an up-trend. It's where we are today. While we are not going back to highs for some time---we do have have room to bust 100...105...110...114.....
Once the buy-backs come back (next year) we'll go back up a monster wave to 150 for ATH.
It's a boy! I mean but!!!

09/29/2020 JPMJPM looks to have finished a complex wave 4 in an expanding triangle. Looking for a wave 5. It is hard to be bullish on banks, but given the recent allegations again JPM and the trendline support holding, it may be worth a shot at letting some monthly options play out.

JPM_Base of Wave Three has arrived. BULL MARKET LIVES!There are a lot of different models for this, and It's hard to determine, but some of the models I have seen have the first wave forming at the first high after the covid sell-off (96.55), but I consider that cluster part of market chaos/confusion and consolidation and therefore part of the formation of wave 1, wave 1 saw the highs of 115, initially I believed, the pullback of wave two was ending at the end of July/Beg. Of Sept---but now I think it extended lower in what seemed a long and torturous wave…but! Just over the last 1-2 days the base has started to form and we are beginning wave 3, which will likely back shortly 115 (earnings?), then a wave 4 pullback will be swift and decisive (opposite of wave 2—as per the typical convention of these waves) after which JPM will progress upwards towards a level that will surpass their ATH…which, could even come sooner than later...Post election might see an end of short wave 4 pullback and final wave 5 going into the new year.
Regardless of the exact trajectory the waves take, I do believe Banking is showing signs of rotation---not necessarily reflective in a price extension at current, but by the signals that other sectors are taking a breather, and the banks are slowly creeping out of consolidation and in an upward leaning trend.

ABC Bullish Earnings 10/13 BMOStop under C
R overhead
This one has tried to break out before but did not hold on
Times are tough for banking stocks. I guess we have to have banks though.
Possible T2 133.4 to 144. I would be focused on T1 for now (o:
Short interest in low
Not a recommendation

JPM - Elliottwave analysis - trade update Welcome guys,
CycleWave is the top author sharing trade ideas based on EW analysis since last four months on the global stocks, currency pairs, cryptos, future indices and commodities.
JPM - It is in (Y) wave as ABC zigzag and 4th wave of C down is in progress, which was earlier predicted when price was at 103. This is the update of that trade. Sell on bounce near 95.00-96.50 for again one more down cycle to end the correction.

JPMORGAN AND CHASE path and direction Hello everyone
JPMORGAN at critical level
as shown in chart
good luck


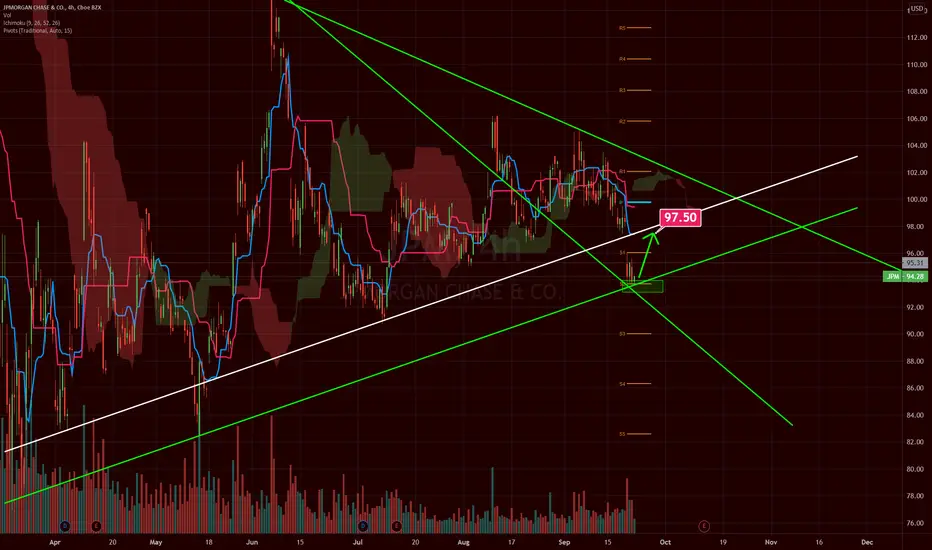
JPM - Long to $97.00 - $97.50NYSE:JPM
Just a long idea:
Entry $94.00 - $94.50
Take profit $97.00 - $97.50
Stop loss or hold long is up to you
Disclaimer!
Possible Head & Shoulders for JPM?JP Morgan is under pressure, and rightfully so, considering they've been caught with their hand in the cookie jar, once again, ahhhh the blasphemy!
I always find it ironic when the same banks calling Bitcoin a fraud get caught for fraud or money laundering, it strengthens the argument for Bitcoin every single time.
Possible H&S breakdown, bearish cross on the KST. I zoomed in on the KST so the bearish cross is noticeable, but if you zoom out there's a noticeable H&S pattern.
Descending Triangle on the RSI, similar to the blue pattern in the price action, potentially double bearish confirmation.
The FED is busy saving the DXY & trying to prevent the USD from losing world reserve currency status, so maybe they'll let assets decline until elections are over, who really knows? But if the USD collapses I don't imagine all assets prices will increase, it could get fugly.

$JPMas you can tell all financials went down today, with no reason. but from what I can see and expect is in the gap circled (white) to get filled within these next days before earnings (October 13). I think we will be hitting 105 by next week in a bullish market.

JPM - Long to $102, $105My trade plan is continuous keeping all of Long positions in the Banking Sector.
JPM and BAC can return to Uptrend after hit the Bottom Support Trend Line.
Disclaimer!

JPM to LongTriangle around EMA144
Near breakout -- not sure which direction
Entry: 103
Stop: 98;
Target: 120; reward:risk=3:1
I am not a PRO trader. I need few months to practice trading strategies.
If you like this idea, please use SIM/Demo account to try it, until my trading plans get high winning rate.

JPMorganc Chase (JPM) - Sell on bounceJPMorganc Chase (JPM) - it is underperforming the SPX and other financial stocks. It is in WXY complex correction as double zigzag and C of Y wave is in progress. So sell on small bounce up to 102-103.80 with stops above 105.30 for target zone below 90 or even lower as primary target. The pattern confirmed below 99.45 level. so it can traded as breakdown trade set up also.

