Double BottomA double bottom chart pattern is a chart pattern used in technical analysis to describe the fall in price of a stock or index, followed by a rebound, then another drop to a level that’s roughly similar to the original drop, and finally another rebound.
KOC trade ideas

BOLLINGER BAND Indicator of VolatilityA Bollinger Band is an Indicator of Volatility, and the technical analysis tool is defined by a set of lines plotted by standard deviations, one positively and other negatively, and away from a simple moving average (SMA) of the security's price.
When the markets become more volatile the bands widen.
When the markets become less volatile the bands contract.

DOUBLE TOPDouble top pattern, is a reversal pattern, that occur when the underlying investment moves in a similar pattern to the letter "M" and then there has to be a breakdown point where the pattern reverses the trend, and it's used as part of a trading strategy to exploit recurring patterns, but these patterns are often used in conjunction with other indicators beacuse it can easily lead to fakeouts or mistaking reversal trends.
The volumen is usually lighter on the second peak.

HEAD & SHOULDERS
The head and shoulders pattern is a very reliable trend reversal pattern, and it has a base with three peaks, but with the characteristic highest central peak, and predicts an uptrend reversal to the bearish one.

DOWNTREND PATTERNA downtrend is detected when price action progressively shows lower peaks and lower lows over time.

Downward Swing to come for Coca Cola Hi Traders
Coca-Cola has almost the perfect set up for taking another downswing over the next couple of days except for SMA100 and SMA200 the form a very bearish pattern. SMA100 and SMA200 of course are still laging a bit behind the corona-crisis but soon will also change into a bearish formation too.
Also the Hitman indicator shows its 4th bear-signal in a row implying another down-rush coming up next for KO.

Riding up the pull back? the price showing reversal trend to the upside. here is the possible setup if you wanna catch the bull ride....or maybe just a short pullback of the bigger timeframe.. who knows?!


$KO - potential upside move to $40-41At a quick glimpse, we see divergence between stock and indicators.
Stock's price trend is on a downward slope (red line)
OBV, MACD, and RSI are all trending upwards (violet lines), with RSI gradually coming out of oversold levels (30 or below)
This difference in trend direction tells us there is bullish sentiment behind KO - meaning investors believe KO is at a great price to buy - which will eventually result in change in the direction of the trend.
Please feel free to leave any insight or feedback!!
*this is not a solicitation to buy/sell trades, rather notes for personal use*
Entry 37.98
TP1: 39.03
TP2: 41

KO - 50% retracementKO has lost 37% of its value and has retraced 50% of its move off the 2008/9 lows. There has been very heavy selling and extreme volume on the downside. Weekly RSI has hit a level not seen since 1979. Today felt like capitulation selling to me in the last hour. For the better part of two and half hours prior to the last 90 minutes, someone took every share at $40 until the weight of the market was too much. If there is a bounce next week in the markets I expect KO to outperform for the Dow 30.

$KO can fall in the next weekContextual immersion trading strategy idea.
The Coca-Cola Company has a strong downside trend.
This and other conditions can cause a fall in the share price in the next week.
So I opened a short position from $38,13;
Information about stop-loss take-profits will be later.
Do not view this idea as a recommendation for trading or investing. It is published only to introduce my own vision.
Always do your own analysis before making deals. When you use any materials, do not rely on blind trust.
You should remember that isolated deals do not give systematic profit, so trade/invest using a developed strategy.
If you like my content, you can subscribe to the news and receive my fresh ideas.
Thanks for being with me!

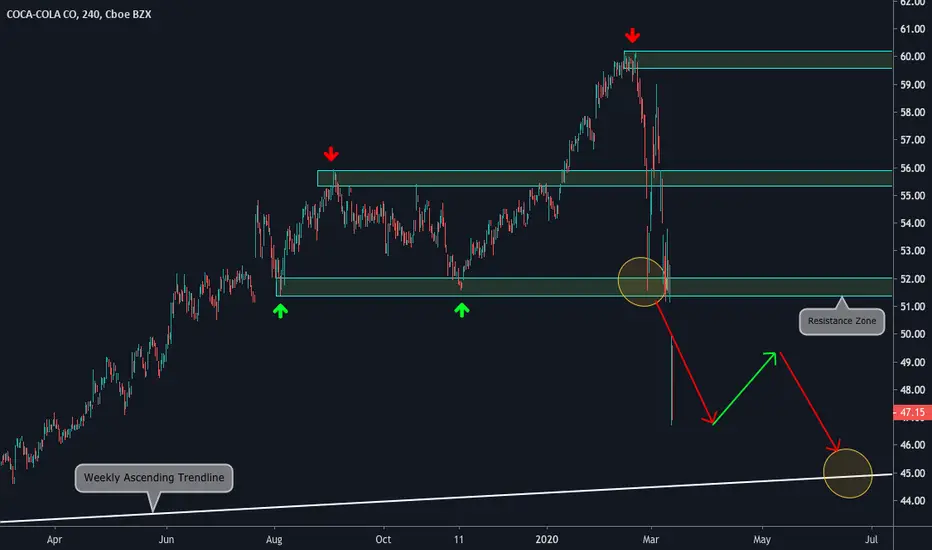
"Coca-Cola: two paths possible" by ThinkingAntsOk4H Chart Explanation:
- Price is on the Weekly Ascending Trendline.
- It tried to break it, but could not do it.
- Now, we have to possible paths: 1) bounce from here and start a new up move; 2) break the Support Zone to start a new down impulse.
- We are waiting for setups on lower timeframes to take trades on this instrument.
Weekly Vision:
Daily Vision:
Updates coming soon!

KO - A Coke and a Smile!KO traded at $41 today and bounced and closed above the 1998 peak in the 45's after hitting $60 last month. A 32% drop top to bottom largely because it is part of the DOW. Looking back to the 1987 crash and the period that followed, KO had an incredible 11 year period. Even through the correction that followed, the stock was up 1000% from its Black Monday lows. The last 11 years have been good for Coke, but were not anything close to the gains from the Black Monday period. Things feel washed out and today's close was just ugly IMO. KO will weather the storm as good as any company out there. It has dealt with dislocations in the market before and will navigate this period just the same. So smile and have a Coke.

"Coca-Cola: Top and Bottom Analysis" by ThinkingAntsOk4H Chart Explanation:
- Price broke the Support Zone (now Resistance Zone) on an important down move.
- Expect a correction from here.
- After that, price is going towards the Weekly Ascending Trendline.
Weekly Vision:
Daily Vision:
Coke support levelGood buy at these level historically with the support trend lines however, any bounce I would be concerned about a forming head and shoulders pattern on the right shoulder up to $54.61 which can be possible with the overall bearish market sentiment. Good buy between 50.50 & 51.50 for at least a bounce.

Ko Stock will go up Ko Stock will go up .
**Disclaimer** the content on this analysis is subject to change at any time without notice, and is provided for the sole purpose of assisting traders to make independent investment decisions.

Coca-Cola: Is It the Right Time to Buy?The market dropped a lot, and now we have a possible reversal signal. The price reached SMA200, and we got a reversal candlestick pattern.
RSI is going to confirm the price reversal.
If the price can stay above the low of the signal candle, it is possible to search for buy signals using the daily and hourly charts.
Stop orders must be placed below 52.00 support and the local swing low. The main profit target should be 50% of the previous downward movement - it is 56.00 level. The 2nd profit target should be placed at 60.00 level.
If you think that the fundamental factors will push the markets downward, well, it can be like this as well. But when any market reaches a true bottom, nobody can be sure that it is the right time to buy.
Follow the signals from markets. Follow the markets. Use the proper risk and money management.
Disclaimer!
This post does not provide financial advice. It is for educational purposes only! You can use the information from the post to make your own trading plan for the market. But you must do your own research and use it as the priority. Trading is risky, and it is not suitable for everyone. Only you can be responsible for your trading.

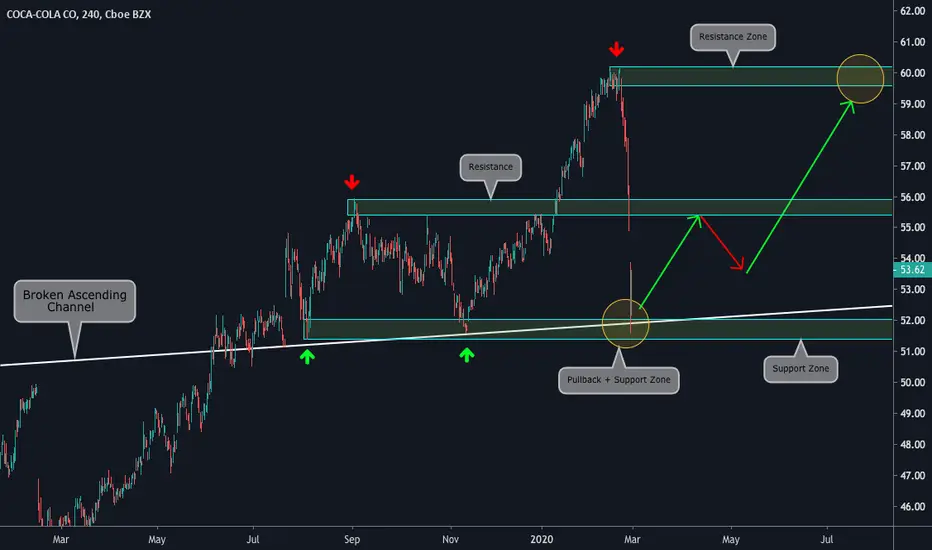
"Coca-Cola: Top and Bottom Analysis" by ThinkingAntsOk4H Chart Explanation:
- After this big fall, price seems to be bouncing on the Weekly Broken Ascending Channel.
- After the Pullback and the Support Zone, price has potential to move up towards the Resistance Zones.
Weekly Vision:
Daily Vision:
Updates coming soon!
Analysis Coca - Cola, 60M TF Hello treders! This is my current analysis for KO, My strategy is based on strong support and resistance levels, volume profile analysis and expected volatility

KO Poised for New HighKO consolidated with a few whipsaw indecision days, but it is now building strength for potential upside action. KO had a pre-earnings run setup by Professional Traders.

"Coca-Cola going for our second target" by ThinkingAntsOk4H Chart Explanation:
- Price broke the Descending Trendline.
- Price reached our first target on the first Fibo Level.
- Price is going towards our second target on the second Fibo Level.
Weekly Vision:
Daily Vision:
Updates coming soon!

Coca Cola Safe on a pullback
Possible long trade on KO if market pulls back.
Safe haven play.
Performs well when market under-performs
Big push into energy drinks to take on Red-bull and Monster.,
Earnings were very good and in a bullish market stock could have surged.

