$LAC up from here: support, elliot wave, price actionI believe LAC may have begun its 3rd elliot wave, with a bottom at $2.33. There also appears to be nice recent strong base support around $2.80. In addition, there appears to be a deviation between price and money flow, as shown with the green arrows - with a potential correction available to push p
−0.000 USD
−41.25 K USD
0.00 USD
About Lithium Americas Corp.
Sector
Industry
CEO
Jonathan D. Evans
Website
Headquarters
Vancouver
Founded
2023
ISIN
AR0925694561
Lithium Americas Corp. engages in the development of the Thacker Pass project. It is focused on advancing Thacker Pass to production it is located in northern Nevada. The company was founded on January 23, 2023 and is headquartered in Vancouver, Canada.
Related stocks
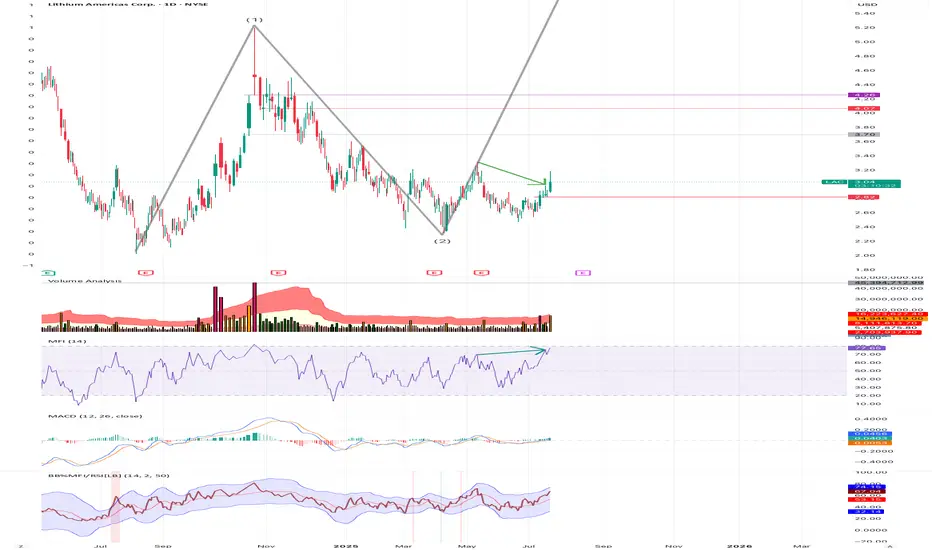
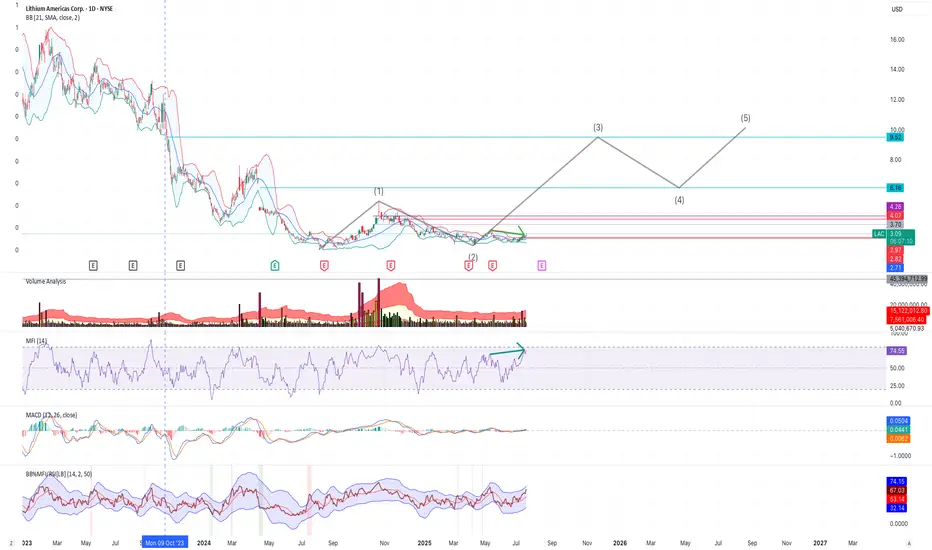
The 3rd Nevada Lithium Elliot WaveI believe LAC may have begun its 3rd elliot wave, with a bottom at $2.33. There also appears to be nice recent strong base support around $2.80. In addition, there appears to be a deviation between price and money flow, as shown with the green arrows - with a potential correction available to push p
LAC (Lithium Americas Corp) – Bottom Reversal with Higher Low FoThe LAC stock chart suggests a confirmed bottom structure, supported by a clear higher low pattern—a strong technical signal that downward momentum has likely ended and a trend reversal may be underway.
After an extended downtrend, the price has formed a rounded bottom with two notable troughs, ind

Lithium Americas Corp. (LAC) - LongLong entry at 2,52 USD with a stop loss 1,98 USD.
Profit taking: 4,14 USD, 6,71 USD and 10,55 USD.

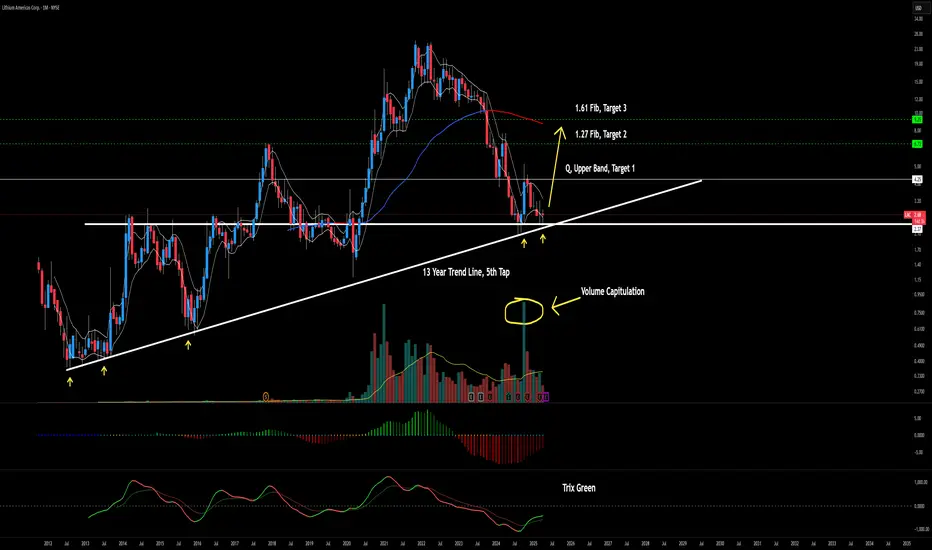
$LAC about to break out?I've been watching NYSE:LAC for a LONG time. I've traded this one in the past.
We fell all the way back to a major support zone from all time highs, and we also landed right on the long 13 year trend line for a 5th test.
Now, I typically dont take trades off trends that have been tested 4 times
BUY LACThis is a stock with big potential for value. A target of the all time high can net us 700% return. Manage Your risk and good luck

$spy $lac What if this is H&S BottomWhat if this is a H&S bottom in Lithium? Significant upside if so.


$LAC yieahhhyieahhhh
looking nice risk reward here.
A lot of confluences on the high volume area around $10.
Going to stop buying starbucks outside to move it instead to this bad boy.
Yieaahhh

ONE FOR THE FUTURE (BUY TARGET AT 48.2)One for the future, buy and hold for targets at 48.2+/-
Price has completed one 13-year cycle and the first half of the next cycle will see a gradual bull trend completing the 7-year cycle.
Trade safe, goodluck

See all ideas
Summarizing what the indicators are suggesting.
Oscillators
Neutral
SellBuy
Strong sellStrong buy
Strong sellSellNeutralBuyStrong buy
Oscillators
Neutral
SellBuy
Strong sellStrong buy
Strong sellSellNeutralBuyStrong buy
Summary
Neutral
SellBuy
Strong sellStrong buy
Strong sellSellNeutralBuyStrong buy
Summary
Neutral
SellBuy
Strong sellStrong buy
Strong sellSellNeutralBuyStrong buy
Summary
Neutral
SellBuy
Strong sellStrong buy
Strong sellSellNeutralBuyStrong buy
Moving Averages
Neutral
SellBuy
Strong sellStrong buy
Strong sellSellNeutralBuyStrong buy
Moving Averages
Neutral
SellBuy
Strong sellStrong buy
Strong sellSellNeutralBuyStrong buy
Displays a symbol's price movements over previous years to identify recurring trends.