LLY One-Day Reversal?double speculation?
on 21 September false BO on Descending Triangle (final phase of the Rounding Top) and yesterday One-Day Reversal
LLY trade ideas

LLY daily indecision candle overpriced at all time highOrder SELL LLY NYSE Stop 325.50 LMT 325.50 will be automatically canceled at 20230101 00:00:00 EST
LLY daily indecision candle overpriced at all time high retest gap with exhaustion volume.

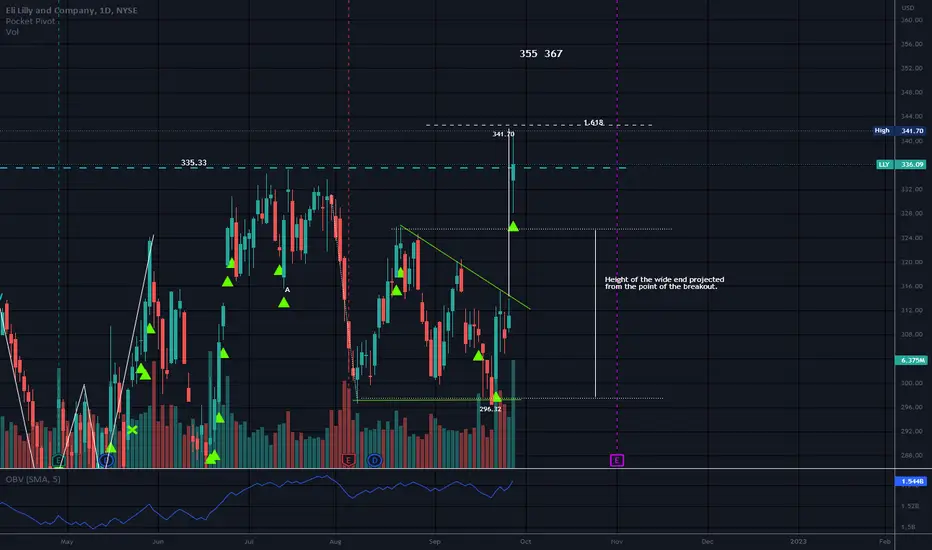
Descending TriangleThis one broke to the upside and also broke the resistance of the rectangle.
There must have been a good news event but I am not sure.
I guess we just never know!
No recommendation.
This breakout is almost exactly the height of the wide end of the triangle so far. It could go higher but measuring the wide end and projecting it from the point of the breakout is a one way to guesstimate a target
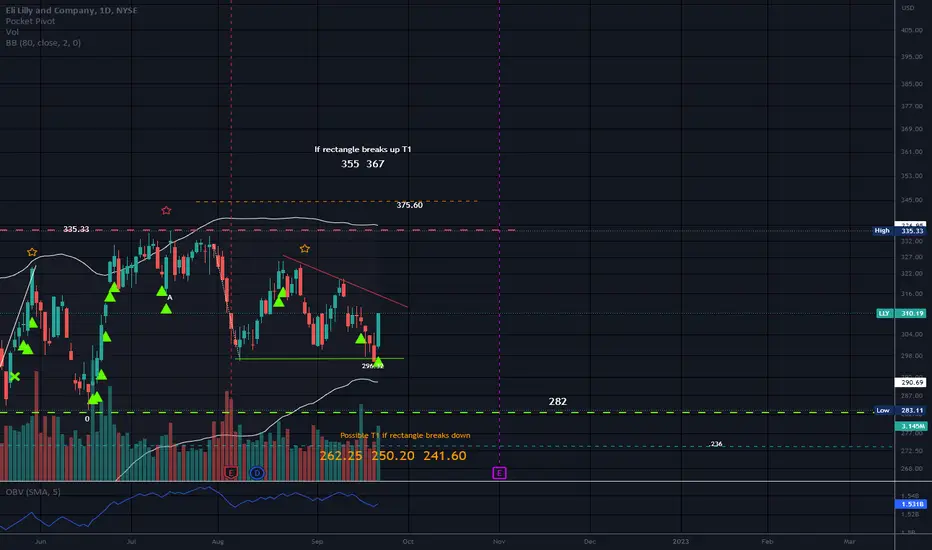
RectangleDescending triangle that is neutral until a trendline is broken.
The Rectangle is also a neutral pattern.
Upgraded by analysts.
Also a possible H&S pattern.
No recommendation
$LLY Setting up Nicely for a Call$LLY Bouncing off 302 (.681) Fibonacci. Trendsi indicators are almost connecting for a call opportunity. Green EMA (Middle line), Money Momentum flowing right on top of the EMA. As well the RSI right at 40. Waiting for the Buy Signal to confirm movement to the upside. Even with Powell speech, LLY was not really affected by it. Still trading within its zone when the Fibonacci was place back in 16 June 2022.

LLY , LONGTook a B1 in LLY near close
Above its GLB
in lower third of uptrend channel
50 sma takeback today ( my cue)
Morning starish reversal pattern aug 10-13 followed by WP through 10/21 ema's
Entry 317.16
Stop - 309.38
PT1 - 324.93 , sell 1/4 , stop up to half
PT1 - 332.71 , then add mode ~

Eli Lilly and CompanyEli Lilly and Company
Price 301.17 P/E (Trailing) 48.61
Change -3.44 P/E (Forward) 32.37
Change % -1.13% Dividend Yield 1.29%
Prev Close 304.61 Dividend 3.92
Volume 2,198,663 Market Cap 293.72B
Year Low 220.20 EPS (Trailing) 6.27
Year High 335.33 EPS (Forward) 9.41

$LLY with a Bullish outlook following its earnings #Stocks The PEAD projected a Bullish outlook for $LLY after a Negative Under reaction following its earnings release placing the stock in drift D with an expected accuracy of 50%.

LLY Shortcounter trend, RSI divergence
Earning: 8/4/2022 Est. 1.72
Short 330
Stop 337
Target 310 280
Risk management is much more important than a good entry point.
I am not a PRO trader.
In my trading plan, the Max Risk of each short term trade should be less than 1% of an account.

Rectangle//Short if Bottom Trendline is BrokenShort if bottom trendline is broken at 282.
Possibly a Rectangle Top and is a neutral pattern until a trendline is broken.
I have been watching this for a while now.
Earnings miss.
Short if bottom trendline is broken at 282.
No recommendation

$LLY Keep on your portfolio!Eli Lilly and Company is showing a strong momentum ahead of earning report.
its one of by favorite ones.
--TradeWise--

$LLY looks ready to breakout$LLY daily chart. IT closed nicely on Friday even though most of the stocks were down a lot. After an up move, it is now moving sideways inside this rectangular range. Looks ready for next upmove once we break this range on the upside. Once we break above 335, looking for a 8% up move in this one.

7/17/22 LLYEli Lilly and Company ( NYSE:LLY )
Sector: Health Technology (Pharmaceuticals: Major)
Market Capitalization: $315.073B
Current Price: $331.60
Breakout price: $334.70
Buy Zone (Top/Bottom Range): $314.00-$292.90
Price Target: $364.20-$367.50 (2nd)
Estimated Duration to Target: 112-120d (2nd)
Contract of Interest: $LLY 10/21/22 350c
Trade price as of publish date: $13.50/contract

Keeps on Going!LLY has had an amazing run to the upside.
Some would think it is a bit overvalued here, but that does not always matter.
Value is not always the most important thing it seems, so it just depends on when folks are ready to sell.
It is like a "Domino" effect
Be safe up there
No recommendation.
Spinning top right now on daily/indecision

WallStreet Trading: Buysignal LLYThe stock LLY on our US watchlist just broke out of a sound base and triggered a buy signal. We are adding a 1/2 position to our US model portfolio.
SL can be set at 314.9 (4% risk). Profit target is > 10%.

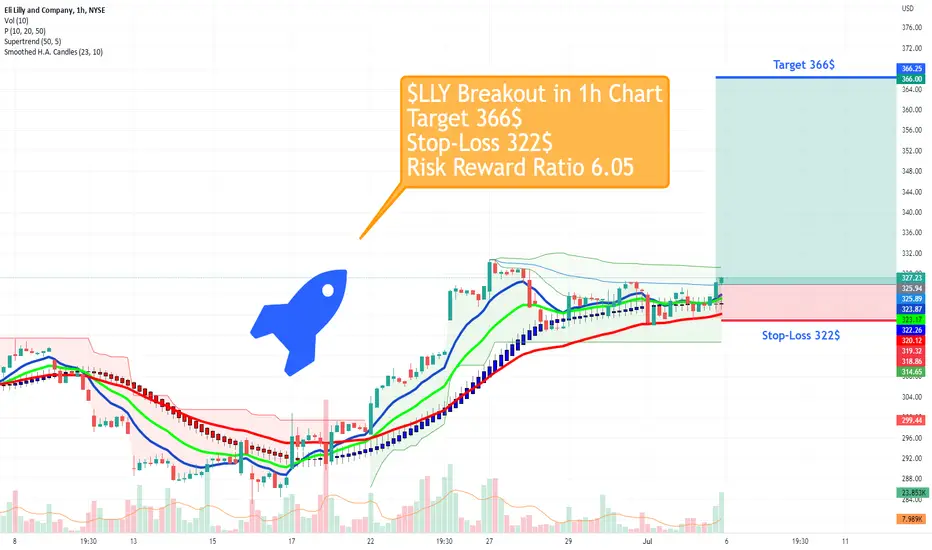
$LLY Breakout #fintwit #supertrend#LLY Breakout 🚀 in 1h Chart - Target 366$ 🧲
All Entry Criteria have been met:
1. Price above 10, 20 & 50 EMA ✅
2. Consolidation Phase in Uptrend ✅
3. Breakout on above average Volume ✅
$LLY All Time High BreakoutBiotech/Healthcare are certainly seeing inflows of money from institutions. The RS on this name along with the clear volume accumulation is really nice. Potential consolidation into ATH Breakout.

LLY Fib Circle Scenario (MACD top)Comparing two points of price and MACD
The MACD is very similar in both points, very over extended
This correlates well with the 1.618 fib level, which allows price to move down along the circle as the MACD retraces, as seen in the first scenario (0.618)

LLY New All Time HighsLLY made a New All Time High on Friday
Clean Base Breakout
8 Week Long Base
Price above 200DMA
Volume is higher than 50 Day Average Volume
Measured Target: 353

$LLY#$LLY
Today close important. Need to open and close above $314
Stock had done week during the fall last few weeks.
Need Volume to buy.

Symmetrical TriangleThis pattern is neutral until a trendline is broken with a trend in that direction.
Price has hit the resistance line of the triangle twice with a candle wick with the 2nd attempt to break the resistance today. The bottom trendline is support until broken.
Short percent is very low and under 1%.
There is a suspicious W in this chart. There are rising wedges below price that are not valid as the bottom trendline has not been broken.
No recommendation.

LLY BREAK OUTAfter a 60 day base and a 2T VCP from 11.75% to 5.85% LLY gives a low risk entry point @ 294.34. Will manage as 1/3 profit on 1R (Moving stop to break even), 2/3 profit at 2R and give the rest room for a higher move.

$LLY Breakout - Target 356$ Same rational as always: strong up move, consolidation and reclaim of vwap - Target 356$
